There is clear evidence that precipitation in the Northeast is more intense than it was in the past.
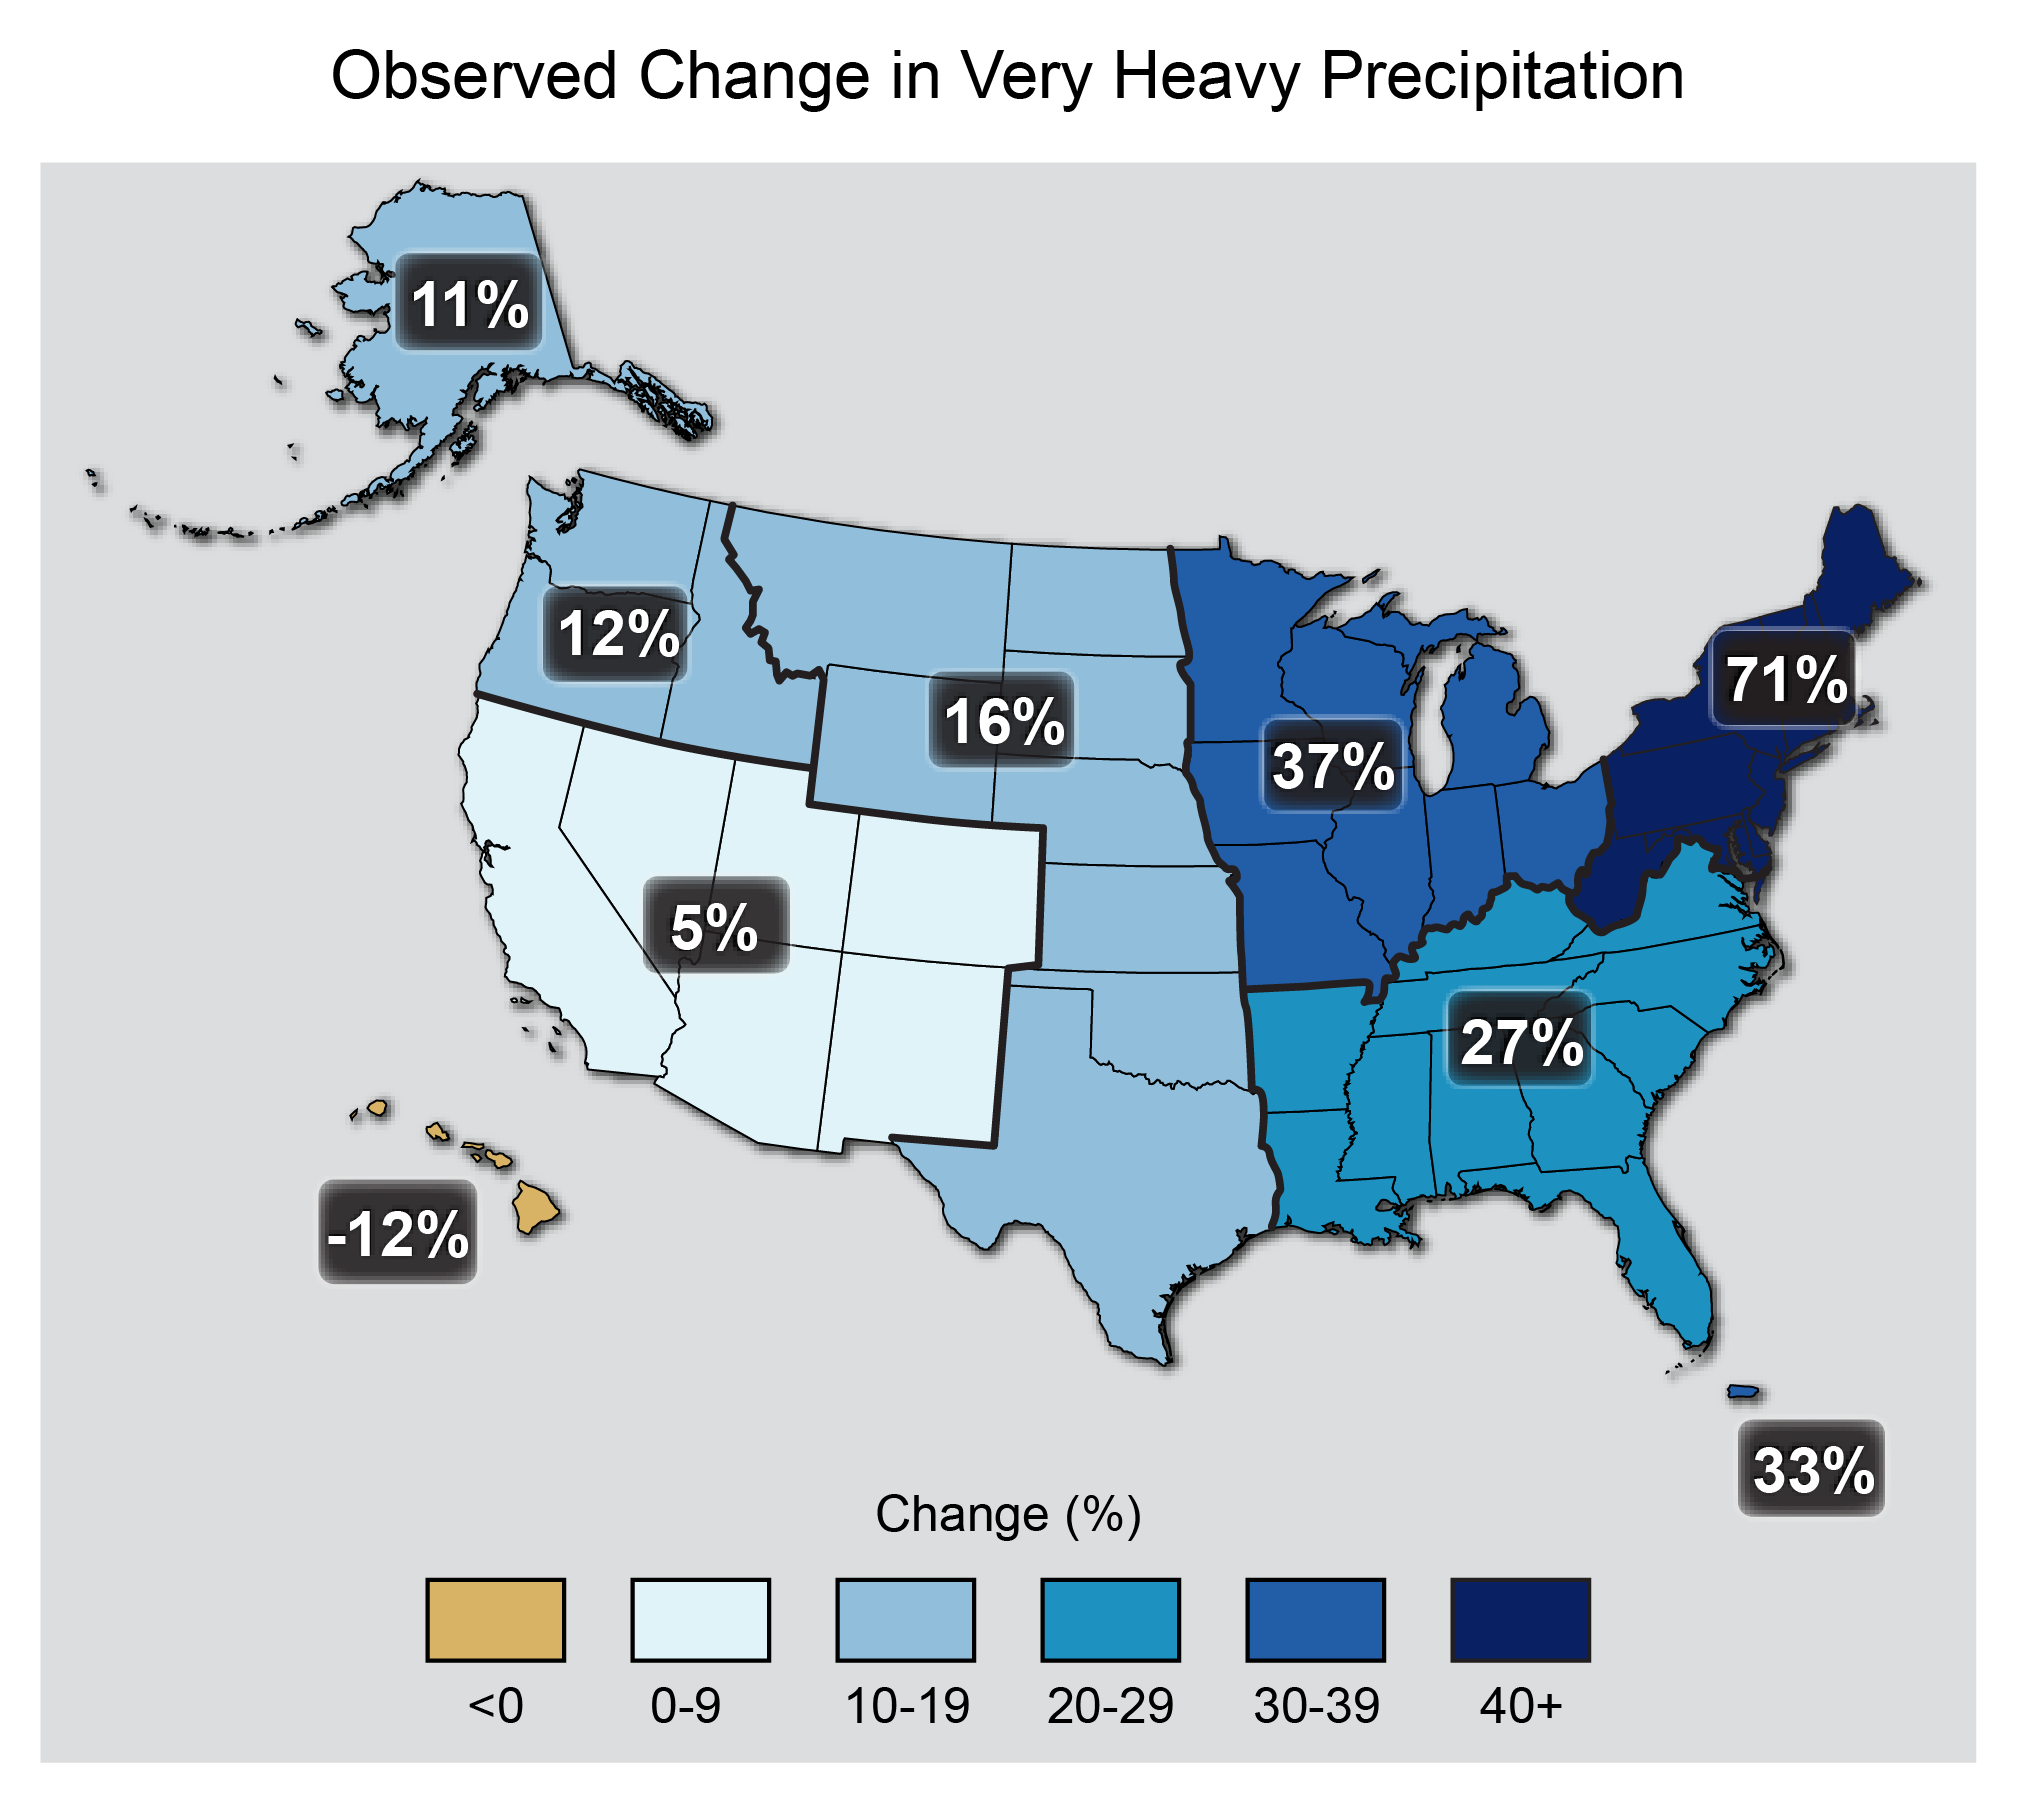
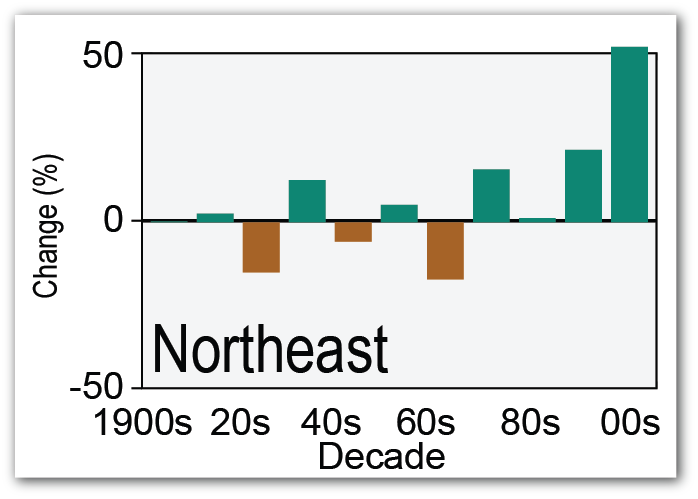
The increase in the Northeast has been greater than any other region in the U.S. (Figure 1). Between 1901 and 2014, total annual precipitation increased slightly (7%), but that arriving in extreme events (downpours) increased by 41% (Huang et al. 2017). Heavy downpours are occurring more frequently in the region, most often in the summer and fall. Recent investigations of regional weather records show that the biggest increases have occurred in the last 2-3 decades (Figure 2); a distinct change in the long-term record (Huang et al. 2017, Kunkel et al. 2013, Spierre and Wake 2010). This trend of more intense rainfall is projected to continue. One report suggests that by the end of the century, the entire Northeast region may receive 21% more rainfall in events that drop greater than 1 inch of rain at a time (Kunkel et al. 2013).
More Water Can Stress Out Stream-Crossings
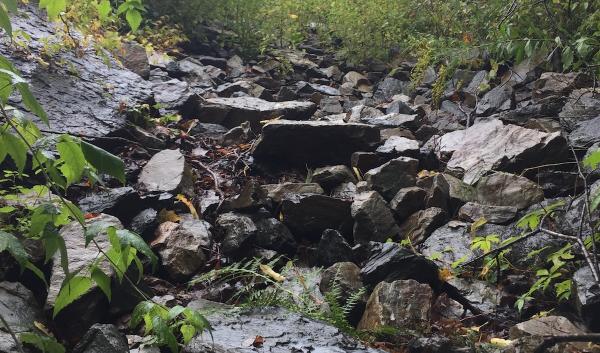
Flash floods, and seasonal flooding events can trigger catastrophic disturbances in forest ecosystems when floodwaters exceed the ability of a culvert to pass water (known as the ‘hydraulic capacity’ of the structure). When culverts or stream structures are overtopped or plugged by woody debris (like sticks and branches), this can lead to soil disturbances and streambank erosion that often deliver large volumes of sediment downstream. Flood events caused by undersized or poorly designed stream-crossings can impart major damage to wildlife habitat and adjacent properties. Stream-crossings have a lower risk of failure if designed appropriately for the stream, and with consideration of current and future regional climate conditions. Careful evaluation of structure size considering all of the factors that influence potential flood-risk can minimize future risks. Managers may also seek additional consideration of the role of land-use change and wetland losses that may exacerbate flood hazards when evaluating stream crossings (Wisconsin Wetlands 2018).
Stream-Crossing Infrastructure, What Are the Options, How Much Will It Cost?
Stream-crossing installation, maintenance and retrofitting is expensive, there is no way around it. Of course, there are upfront installation costs, and maintenance costs to budget for when considering an infrastructure replacement project. Yet, there are also “hidden” long-term costs to be considered, like repeated replacements and repairs for undersized or poorly designed structures that fail after large rain or flood events. With precipitation inputs on the rise, the likelihood of infrastructure blowout and failure for inadequately designed structures increases over time.
There are several crossing options to choose from, for example - bridge, round culvert, arch culvert, or plastic culverts. Ball parking average costs, a steel arch culvert designed for the natural features of the stream has a 50-75yr life span, whereas a standard round culvert (hydraulic designed) has a lower 25-50yr life span, and carries a higher replacement and repair risk (Gillespie et al. 2014). Crossings designed for the natural characteristics of the stream have an impressive record of withstanding large rain and flood events. Using design tools like the Forest Service Stream Simulation tool, specialists evaluate local stream characteristics, and natural variation of the stream channel during the design process. Although natural design is an ecologically sound and better alternative to other methods, this method can also increase costs by 9-22% (Gillespie et al. 2014).
There are key differences worth considering in the stream crossing design process such as the stream’s capacity to move floodwaters, aquatic organism passage effectiveness, installation and replacement costs, annual maintenance costs, and structure lifespans. In addition to structural considerations, there are several costs such as up-front installation costs, maintenance costs, and possible NRCS cost-share payments that might off set total costs. Based on a 2015 NRCS analysis using actual planning cost data and potential payments from Maine’s 2015 Practice Payment Schedule (Knight 2015), the results suggest bridges and arch culverts can be the lowest cost options with the least long-term maintenance and longest life-spans (Table 1, Table 2).
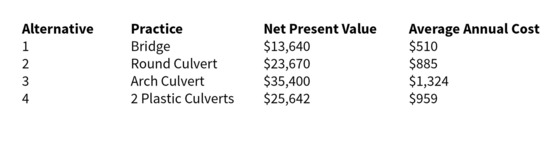
Table 1 shows that when considering the life of the installed practice, the lowest cost option based on total cost is Alternative 1 – the Bridge option, with the net present value being $10K lower than the next lowest cost option (round culvert). This is because although there is a higher initial investment, there are lower maintenance costs over time. The Round Culvert option has a lower initial investment but relatively high (equivalent to 15% of the installation cost annually) maintenance cost. This adds up over 50 years! The most expensive option is the Arch Culvert. Although that option also has no maintenance costs, it has a very high initial cost compared to the other options.
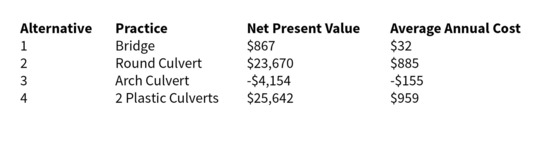
Table 2 presents a drastically different story to a landowner if they qualify for government payments. In this scenario, the Arch Culvert is their best option because the government payment exceeds the cost of installing the culvert by over $4K, or is equivalent to the landowner receiving $155 annually for 50 years. Additionally, this alternative provides aquatic organism passage, provides fish habitat benefits, and is less restrictive to floodwaters in reaching adjacent floodplains during high water events. Based on this NRCS program, the Bridge is now the second best option. The remaining two options (Round Culvert and 2 Plastic Culverts) are significantly more expensive because they do not meet basic qualifications for government payments for fish passages and require fairly substantial annual maintenance.
Note: Before entering into a design project the crossing and stream should be evaluated by a specialist to assess and evaluate local conditions. Contact your local NRCS field office to begin a design project today.
There are several toolkits to help with the design process, such as the ecological approach that simulates the natural stream characteristics and function, designed by the U.S. Forest Service Stream Simulation process.
-
Wisconsin Wetlands Association explored the relationship between upland wetland loss and land use change on flood hazards, find a summary and the report here.
-
The North Atlantic Connectivity Collaborative is a great place to learn more. The site hosts a climate-friendly stream crossings toolkit with technical guides, and real-world case studies
-
Case study: Green Mountain National Forest redesigned several crossings using the FS Stream Simulation Processes http://maineaudubon.org/streamsmart/files/2014/12/Roads_Floods_Economics-Gillespie-et-al-2014.pdf
-
USDA Blog - Healthy Culverts Make for Healthy Drinking Water (2017) - https://www.usda.gov/media/blog/2017/04/10/healthy-culverts-make-health…
-
USDA Blog – How the FS Stream Simulation process can reduce washouts in Vermont (2012) - https://www.usda.gov/media/blog/2012/04/12/forest-service-stream-technology-can-prevent-road-and-bridge-washouts
from the aforementioned NRCS crossing analysis:
The assumed size, installation and maintenance costs, and lifespan of each alternative are as follows:
-
Bridge: A 12 ft. inside-span bridge’s material and installation actual cost is $10,300. The running deck needs replacement every ten years at $471. The 8x8 and running decks both need replacement every 20 years costing $2,932. The waste block headwalls and steel beams will not need replacement within 50 years. This alternative has greatest ecological value because it maintains streambed biological integrity and also allows for the greatest flow during storm events. For the Government Payment analysis an NRCS one-time payment using Maine’s 2015 payment schedule payments is used as follows: For a 16 x 18ft (288 square feet) bridge, the payment for Practice 578 - Scenario “Bridge with a span of less than or equal to 14 feet” - Unit Cost $44.35 per square foot was used. Total payment is calculated as $44.35 * 288ft = $12,773
-
Round Culvert: four foot metal culvert and installation actual cost $4,000. There is an assumed $600 annual maintenance cost for debris removal starting after year one. The culvert will need to be replaced every 20 years. Although this alternative has the cheapest up-front costs it does not meet NRCS standards and specs for fish passage nor extreme event flow (25-year storm) criteria, nor other compliance requirements. Hence this practice is not eligible for NRCS Program Payments for fish passage.
-
Arch Culvert: 12ft. wide X 5.5 ft. high X40 ft. long open bottom arch culvert and installation actual cost $35,400. No replacement or maintenance cost are necessary. This alternative also has greater ecological value because it also maintains the streambed and allows for greater flow than the culvert options during storm events.
-
For the Government Payment analysis, a NRCS one-time payment using Maine’s 2015 payment schedule payments is used: For a 10ft wide x 6.3-foot-high x 40ft long arch, the payment for Practice 578 - Scenario “Stream Simulation Culvert, without Headwalls” - Unit Cost 988.84 per linear foot was used. Total payment is calculated as $988.84 * 40ft = $39,553.6.
-
2 Plastic Culverts: 2 plastic 4 foot culverts and installation of plastic culverts $9,600 There is an assumed $600 annual maintenance cost for debris removal starting after year one. Plastic culverts will not require replacement within 50 years. This option also does not meet NRCS standards and specs for fish passage nor extreme event flow (25-year storm) criteria, nor other compliance requirements. Hence this practice is also not eligible for NRCS Program Payments for fish passage.
Gillespie, N., A. Unthank, L. Campbell, P. Anderson, R. Gubernick, M. Weinhold, D. Cenderelli, B. Austin, D. McKinley, S. Wells, J. Rowan, C. Orvis, M. Hudy, A. Bowden, A. Singler, E. Fretz, J. Levine, R. Kirn. 2014. Flood Effects on Road-Stream Crossing Infrastructure: Economic and Ecological Benefits of Stream Simulation Designs. http://maineaudubon.org/streamsmart/files/2014/12/Roads_Floods_Economics-Gillespie-et-al-2014.pdf
Huang, H., J. Winter, E. Osterberg, R. Horton, B. Beckage. 2017. Total and Extreme Precipitation Changes over the Northeastern United States. http://journals.ametsoc.org/doi/10.1175/JHM-D-16-0195.1
Knight, L. 2015. Economic Analysis of 4 Different Fish Passage Alternatives with Varying Costs, Annual Maintenance and Replacement in Maine.
https://www.climatehubs.oce.usda.gov/sites/default/files/fish_passage_study_3.pdf
Kunkel, K., L. Stevens, S. Stevens, L. Sun, E. Janssen, D. Wuebbles, J. Rennells, A. DeGaetano, J. Dobson, 2013. NOAA NESDIS 142-1 - Regional Climate Trends and Scenarios for the U.S. National Climate Assessment Part 1. Climate of the Northeast U.S. http://www.nesdis.noaa.gov/technical_reports/142_Climate_Scenarios.html
Spierre, S., C. Wake. 2010. Trends in Extreme Precipitation Events for the Northeastern United States 1948-2007. https://sustainableunh.unh.edu/sites/sustainableunh.unh.edu/files/media/2010_northeastextremeprecip.pdf
Wisconsin Wetlands Association 2018. Exploring the Relationship between Wetlands and Flood Hazards in the Lake Superior Basin. https://wisconsinwetlands.org/wp-content/uploads/2018/06/WetlandsFloodHazards_WWA_web.pdf