

The Overview of Weather Water Land Sites (OWWLS) is a static map that shows locations of weather and water monitoring stations used by the U.S. Drought Monitor to assess current drought conditions. This tool was developed to enable climatologists and water managers to view, in one place, all the weather and water station data locations that are managed by different organizations. Other users are welcome to explore this tool to see if weather and water stations are limited in their area and if involvement in citizen science efforts, such as the Community Collaborative Rain, Hail & Snow Network (CoCoRHaS) or Cooperative Observer Program (COOP), may increase weather and water data collection in their area. Increasing citizen-science weather observations can help confirm drought in specific regions. It can also be used by local and state governments to inform decision making to identify the location of new monitoring sites.
OWWLS shows national weather stations, including: Community Collaborative Rain, Hail & Snow Network (CoCoRHaS), Cooperative Observer Program (COOP), Remote Automatic Weather Stations (RAWS), Soil Climate Analysis Network (SCAN), Snow Telemetry (SNOTEL), stream gauges (USGS WaterWatch), reservoirs (monitored by NRCS), and ground water monitoring stations (USGS) across much of the West. To provide a broader context about where stations are located and where gaps in data may exist, users can overlay spatial reference data (counties or census areas, watersheds, radar coverage, land ownership, land use, and USDA Risk Management indemnities for weather-related causes) on the map. Each layer of information can have the transparency adjusted to make it easier to see the base map or other data layers.
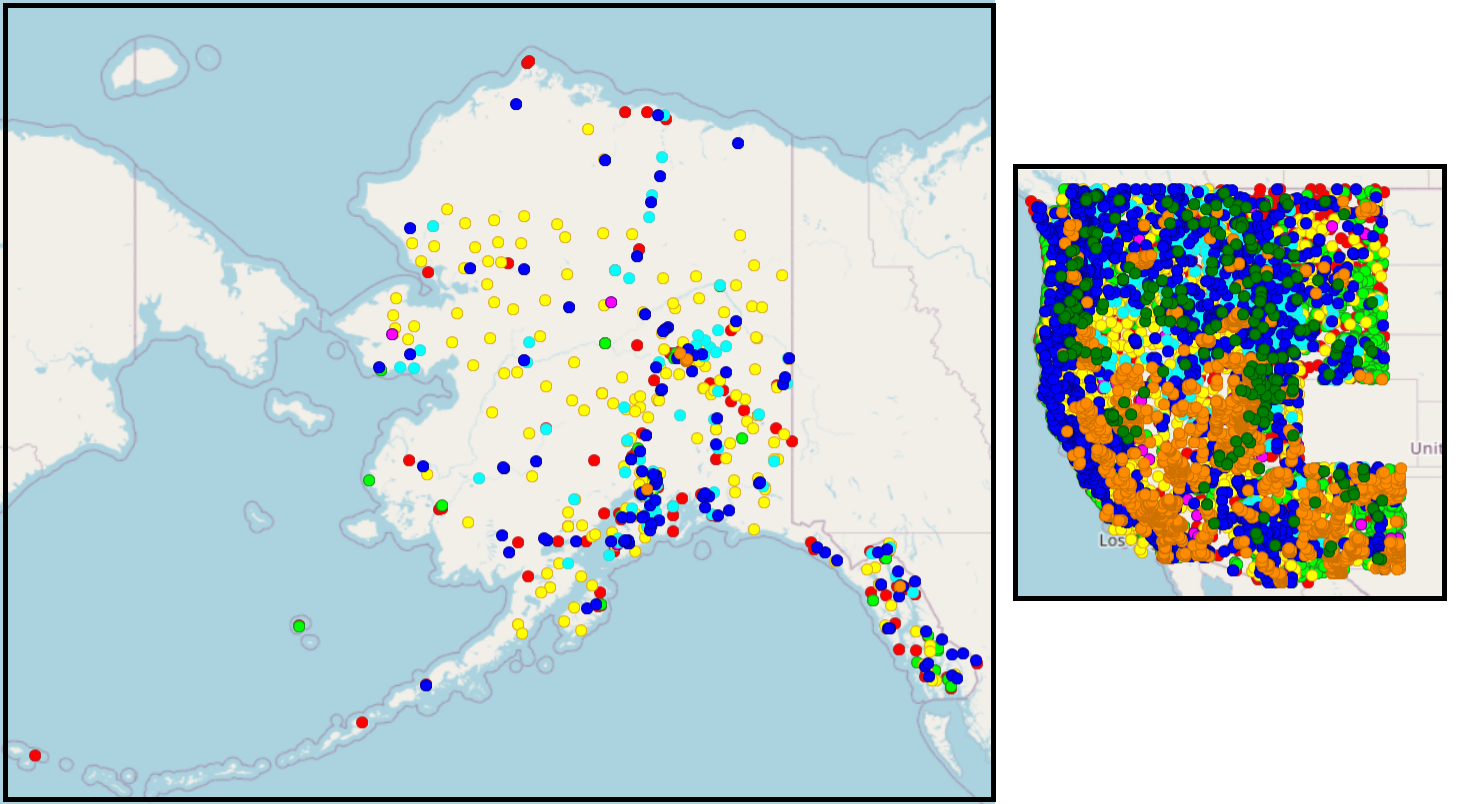
This map below highlights the lack of weather and climate data in Alaska. Alaska is experiencing more extreme weather events and faster warming than other parts of the U.S., making the availability of these data critical. Note that the map overstates currently available data in Alaska, as some of the sites on the map have not been operational for years. In addition, the U.S Drought Monitor uses over 100 climate variables to assess current drought conditions in the continental U.S., whereas fewer than 40 indicators are available to assess drought in Alaska.
Understanding local climatic conditions is important for projecting and preparing for the effects of climate change across complex landscapes. Many models project increases in extreme weather events in the future. Investing in monitoring resources now will help better detect local impacts of climate change and extreme weather events, including drought. OWWLS can help communities, states, and climatologists better understand where more monitoring can improve our understanding of current climate conditions.
This map was made in 2022 as a collaborative effort with the National Drought Mitigation Center and the Northwest and Southwest Climate Hubs. Although it is a static map, the National Drought Mitigation Center and other Climate Hubs are working to expand this map nationally and update weather and water station locations in 2023.
Release Notes
The first version of OWWLS was released in summer 2022 using station data from 2021-2022 for much of the western U.S.