

Every year the USA National Phenology Network (USA NPN) analyse spring leaf out and spring bloom data to see if spring is arriving unusually early or late. They use the First Leaf Index, which is based on the timing of leaf out of lilacs and honeysuckles - two of the first plants to show their leaves in the spring. And they also use the First Bloom Index which is based on the timing when lilacs and honeysuckles first flower.
Early springs can be detrimental to natural and cultivated plant species. When plants leaf out or blossom too early, they are at greater risk of frost damage events. This can be a particular hazard for stone fruit crops. Earlier springs and warmer spring temperatures have also been linked to reduced snowpack and streamflow (Stewart, 2008) and increased wildfire activity in the western U.S. (Westerling, 2016). The NPN provide a useful online map visualization that shows where spring arrives early for a given year. An example of the map is provided below for April 1, 2020. The map shows locations where spring leaf out arrived earlier (in red) or later (in blue) this year compared to the 1981-2010 average. This year, much of Arizona, about half of New Mexico, and the southwestern third of Nevada are experiencing an early spring - in some areas two to three weeks early! However, there are also locations in northeast New Mexico and in Utah that are experiencing a later spring compared to the 1981-2010 average.
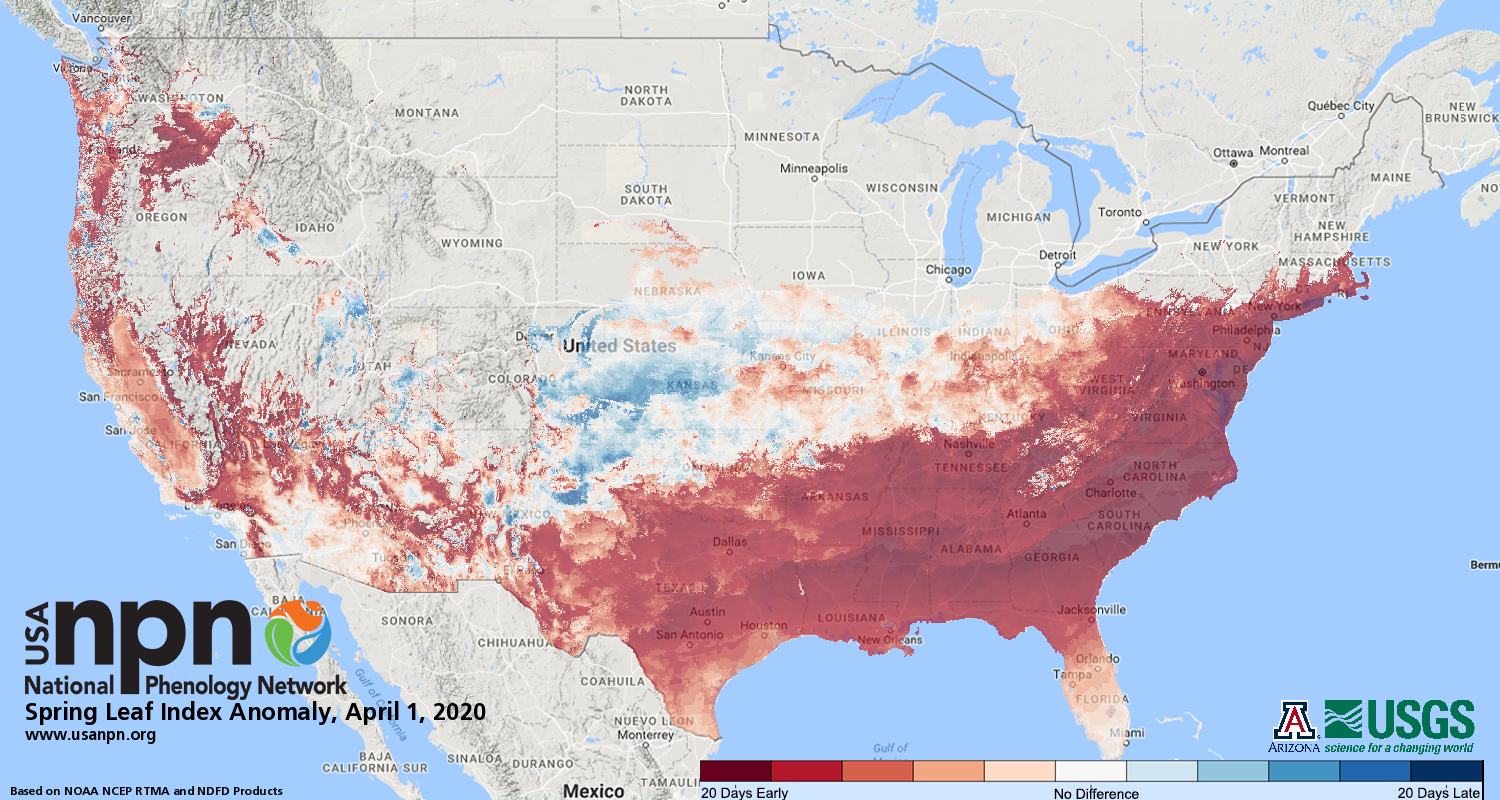
A note about the maps:
The phenology maps created by the NPN are created using Extended Spring Indices, which are mathematical models built using historical observations of the timing of first leaf and first bloom in a cloned lilac cultivar (S. x chinensis 'Red Rothomagensis') and two cloned honeysuckle cultivars (Lonicera tatarica 'Arnold Red' and L. korolkowii 'Zabelii'). These species are used because they are among the first woody plants to leaf out and bloom in the springtime and are common across much of the country.
Other data inputs to the model are temperature and weather events, beginning January 1 of each year (Ault et al. 2015). Maps for the current year are generated using temperature products from NOAA National Centers for Environmental Prediction Real-Time Mesoscale Analysis. More detailed scientific information is provided in the Gridded Product Documentation.
To determine how the current spring compares to the 1981-2010 average, the day of this year that the leaf out (or bloom) was reached is subtracted from the average day of year it was met between 1981- 2010. (Long-term averages are calculated using PRISM Climate Data daily minimum/maximum temperature data).