

To understand if the amount of snow in an area is typical, it is useful to compare it to historical amounts for that area. Percent of normal (or percent of median) is one way to make these comparisons and can be measured for an entire watershed or a specific SNOTEL site. A simple approach is to compare current conditions to the median of a historic 30-year time period (see description and map below). Climate scientists usually look at climate in 30-year intervals, which ensures a reasonable amount of variability in the data (e.g., including both very wet and very dry years). When percent of normal is based on an area and not a single SNOTEL site, it is usually measured across an entire basin (most often on the scale of 6-Digit Hydrologic Unit Code, or HUC). A basin is simply the land and water bodies into which snowpack will melt, defined by geologic features such as mountain ridges. Percent of normal can also be measured by sub-basins, subregions, and regions (different geographic extents of watersheds).
To better explain percent of normal, see the map below as an example. This map is divided into basins and shows SWE percent of normal as “percent of [30-year historical time period] Natural Resources Conservation Service, NRCS, median.” This unit of measurement allows us to compare how much snow there is in each basin on the date the map was made to the historical median of that same date. This first assumes that we understand that the median is a way to show the middle value for a set of numbers— half of the SWE observations are above the median and half are below—providing a good indication of what is “normal” for SWE in that basin.
Median is used exclusively by NRCS for SWE because it is less affected by rare yet abnormal storms and is a better representation of what is “normal” for that area. The comparison is a percentage, with 100% meaning that the value today is exactly equal to that median for the 30-year historical time period. If it is higher than 100%, the snowpack is higher than the historic median. If it is lower than 100%, then the snowpack is lower than the average on this date.
When snowpack is lower than the median, it can mean that an area is experiencing snow drought (less than normal snowpack), despite precipitation being below, at, or above normal. This happens when more precipitation falls as rain rather than snow in the winter. When comparing current observations to the historic median, note that the map is updated daily, and current data show whether the snowpack today is higher or lower than it was on the same day historically. This does not mean that if SWE is above 100% on the day the map was made that the area is not in a drought. It simply means that the level today is higher than the historic median on the same day.
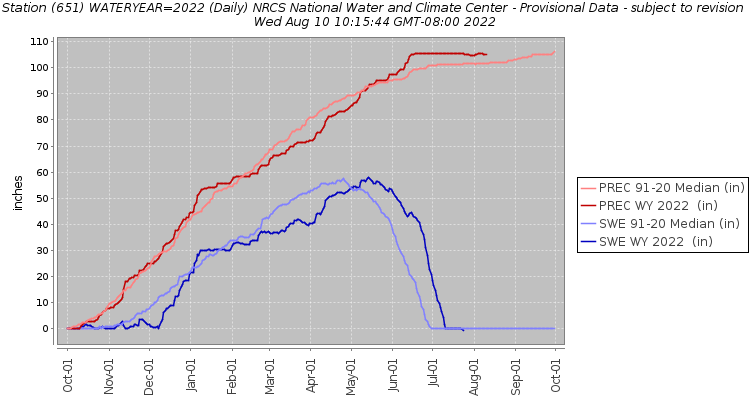
For snow drought, the total volume of snow accumulated over the entire winter is more important than snow level on any given day. A large storm may have come through and dropped a lot of snow, but that does not mean that the total volume of snow for the entire winter is the same. It is just larger than what has been seen on that same day over the historic 30-year time-period. The critical measure of snow drought is the peak of snowpack. If the amount of snow at the peak of snowpack in the current year is close to the amount of snow at the peak of snowpack for historical observations, then snowpack for the current year at that SNOTEL site is within the normal range. To observe the peak of snowpack, scientists use water-year graphs.
-
Snow is a critical source of water in the Northwest, and climate change will affect its availability.
-
Allow users to track snow and total precipitation and compare them to historic medians.
-
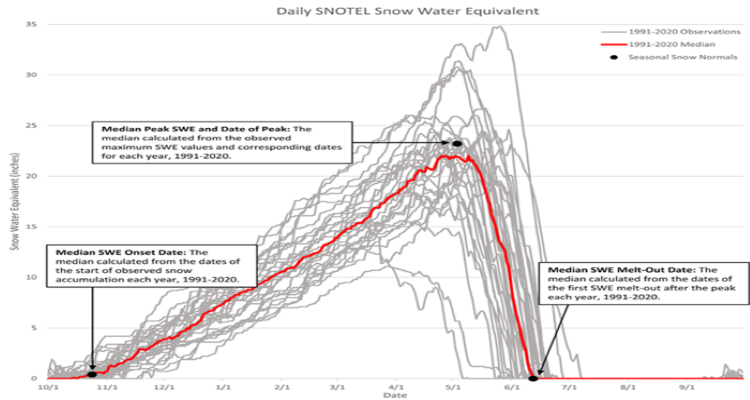
Show important metrics such as the timing and volume of the peak of snowpack as well as timing and rate of snowmelt.