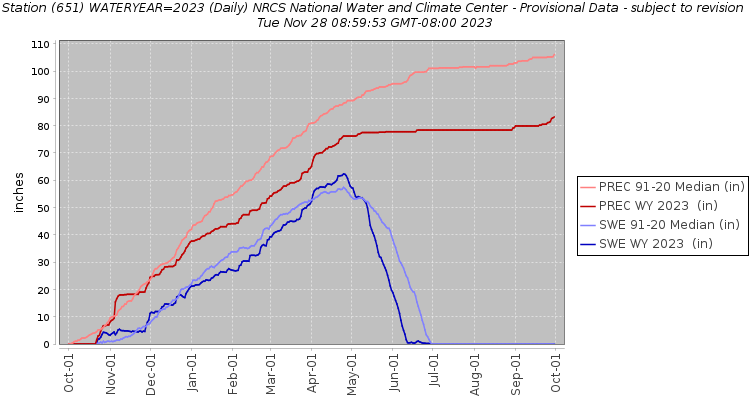
Water-year graphs show snow, total precipitation, and the medians of both snow and total precipitation for each SNOTEL site. SNOTEL sites measure both rain and snow, so as more snow starts to fall as rain with climate change, water-year graphs allow us to compare both forms of precipitation. Graphs are updated daily, making it is easy to compare current or past conditions to the normal at each SNOTEL site. The water year goes from October 1 to September 30 of the following year and is labeled by the year in which the measurements end (e.g., October 1, 2021 – September 30, 2022 is water year 2022). Hydrologists have chosen October as the start of the water year because total annual precipitation then reflects winter snow accumulation as well as summer rainfall. Precipitation that falls during a water year reflects how much water will contribute to actual stream flow and groundwater inputs for that year. This helps water managers understand how much water will be available for human uses (e.g., agriculture), ecological processes, fish, and wildlife.
-
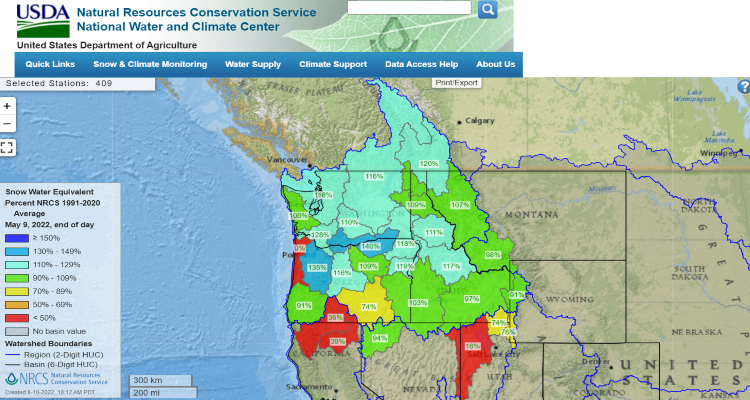
Snow is a critical source of water in the Northwest, and climate change will affect its availability.
-
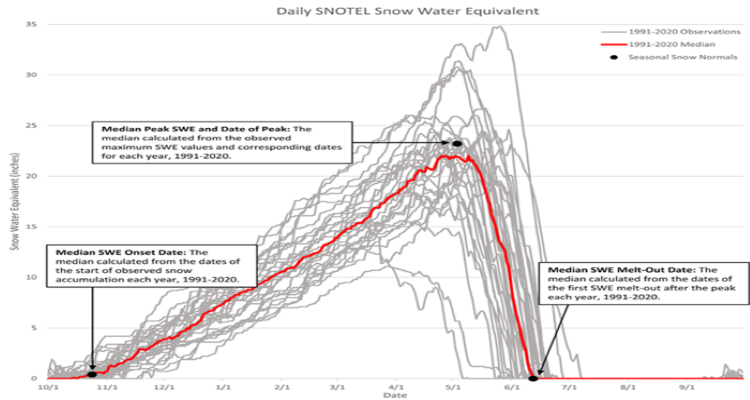
Show important metrics such as the timing and volume of the peak of snowpack as well as timing and rate of snowmelt.