

Estimated reading time: 5 minutes
In March 2023, the Northwest Climate Hub co-hosted a virtual workshop with two goals. The first goal was to enhance drought communication coordination through peer-to-peer learning. The second goal was to improve coordination among local experts in reporting impacts, conditions, and climatology with U.S. Drought Monitor. Local experts and drought committee members from Alaska, Idaho, Oregon, Washington, California, Nevada, Montana, Utah, and Wyoming contributed local information about their process and/or participated in the workshop. There were also participants from Canada. The U.S Drought Monitor authors and National Drought Mitigation Center developed a U.S Drought Monitor process document, as well as a request to local experts for providing input to the U.S. Drought Monitor (see below). The purpose of this page is to share the process document and guidelines for providing input to the USDM with local experts.
Background
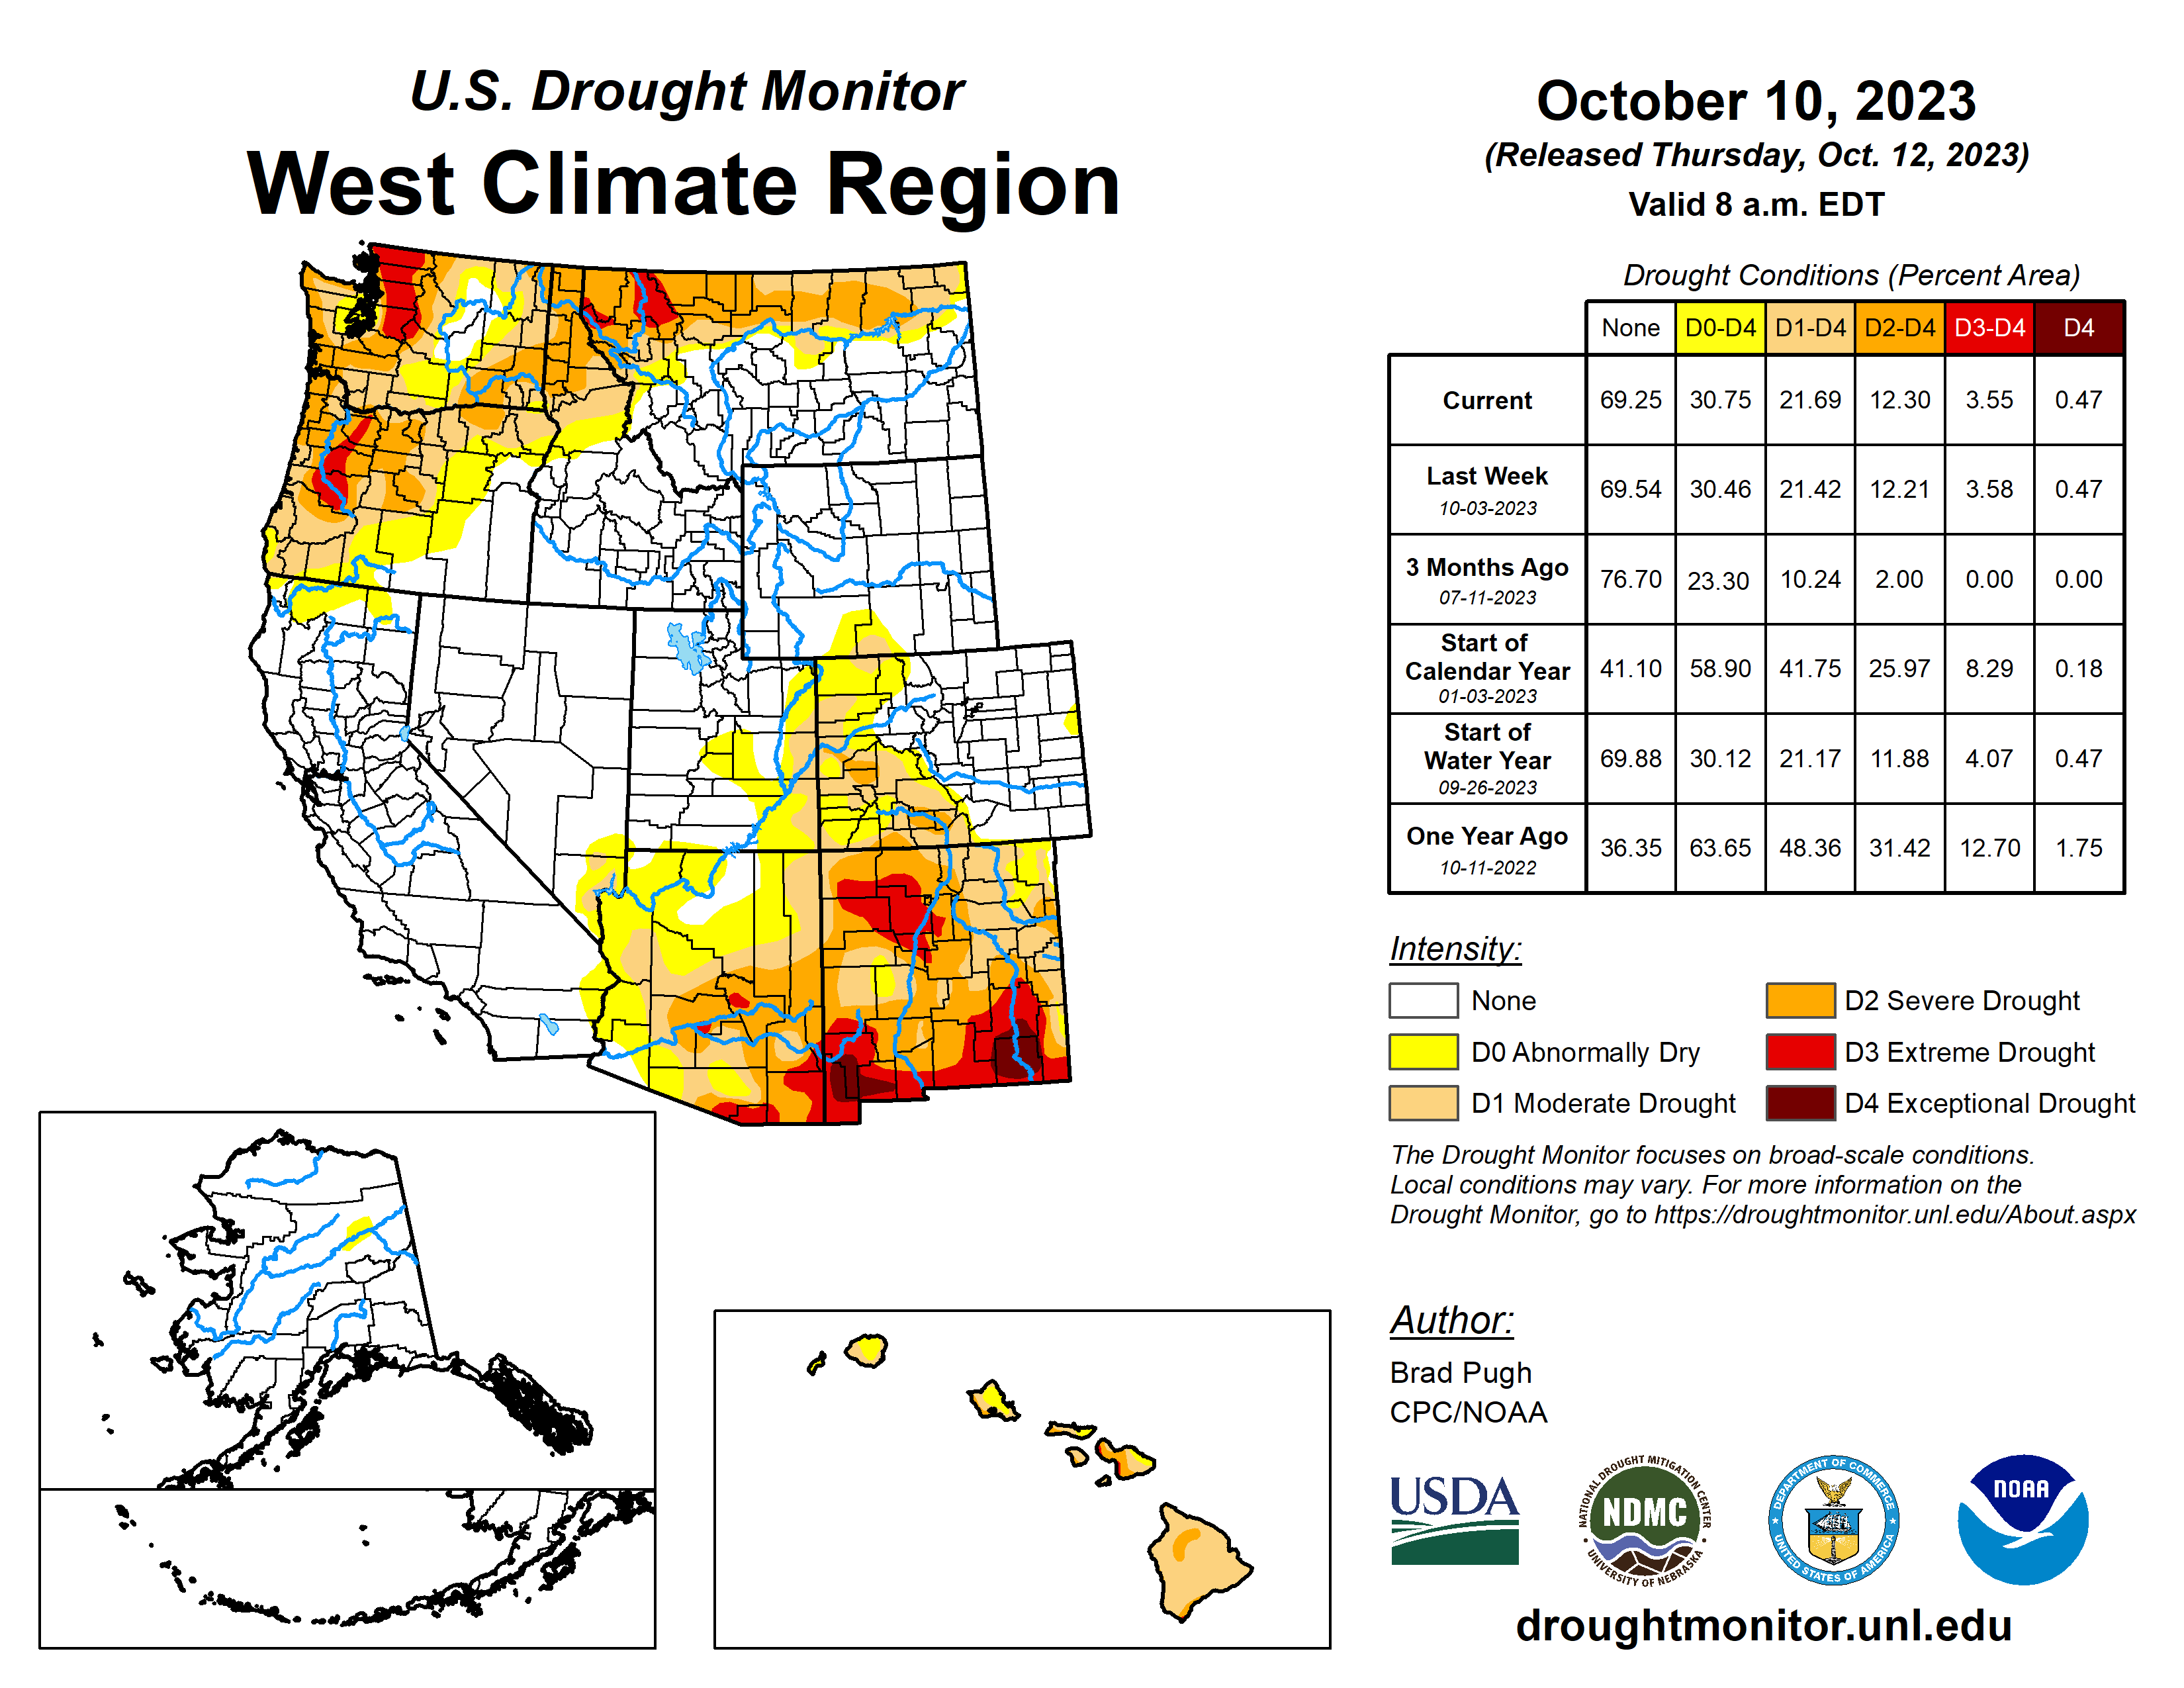
The U.S. Drought Monitor (USDM) is a map, released every Thursday, showing the extent and severity of drought conditions. Several drought metrics are used to develop the map. The map uses six classifications:
- None (white): meaning normal or wet conditions
- Abnormally dry (D0-yellow): areas that may be going into or are coming out of drought
- Four levels of drought:
- Moderate (D1-tan)
- Severe (D2-orange)
- Extreme (D3-red)
- Exceptional (D4-dark red)
The map is a joint product of the National Drought Mitigation Center (NDMC) at the University of Nebraska-Lincoln, the National Oceanic and Atmospheric Administration (NOAA), and the U.S. Department of Agriculture (USDA). Each week, a drought expert from one of these agencies analyzes new data, local expert input, and citizen reports on conditions to produce a weekly update of the map.
What is the U. S. Drought Monitor?
State-level information for Northwest Climate Hub region and bordering states
To find out more information on drought assessment, check out each state’s drought assessment information below. Each document includes the lead representative for the state drought committee or similar organization, a summary of the process for providing recommendations to the U.S. Drought Monitor, as well as a list of drought characteristics, impacts, and challenges for drought monitoring.
To see where weather and climate stations are located throughout the U.S., check out this tool: Overview of Weather Water Land Sites. It is a static map that shows locations of weather and water monitoring stations used by the U.S. Drought Monitor to assess current drought conditions. This tool was developed to enable climatologists and water managers to view, in one place, all the weather and water station data locations that are managed by different organizations.
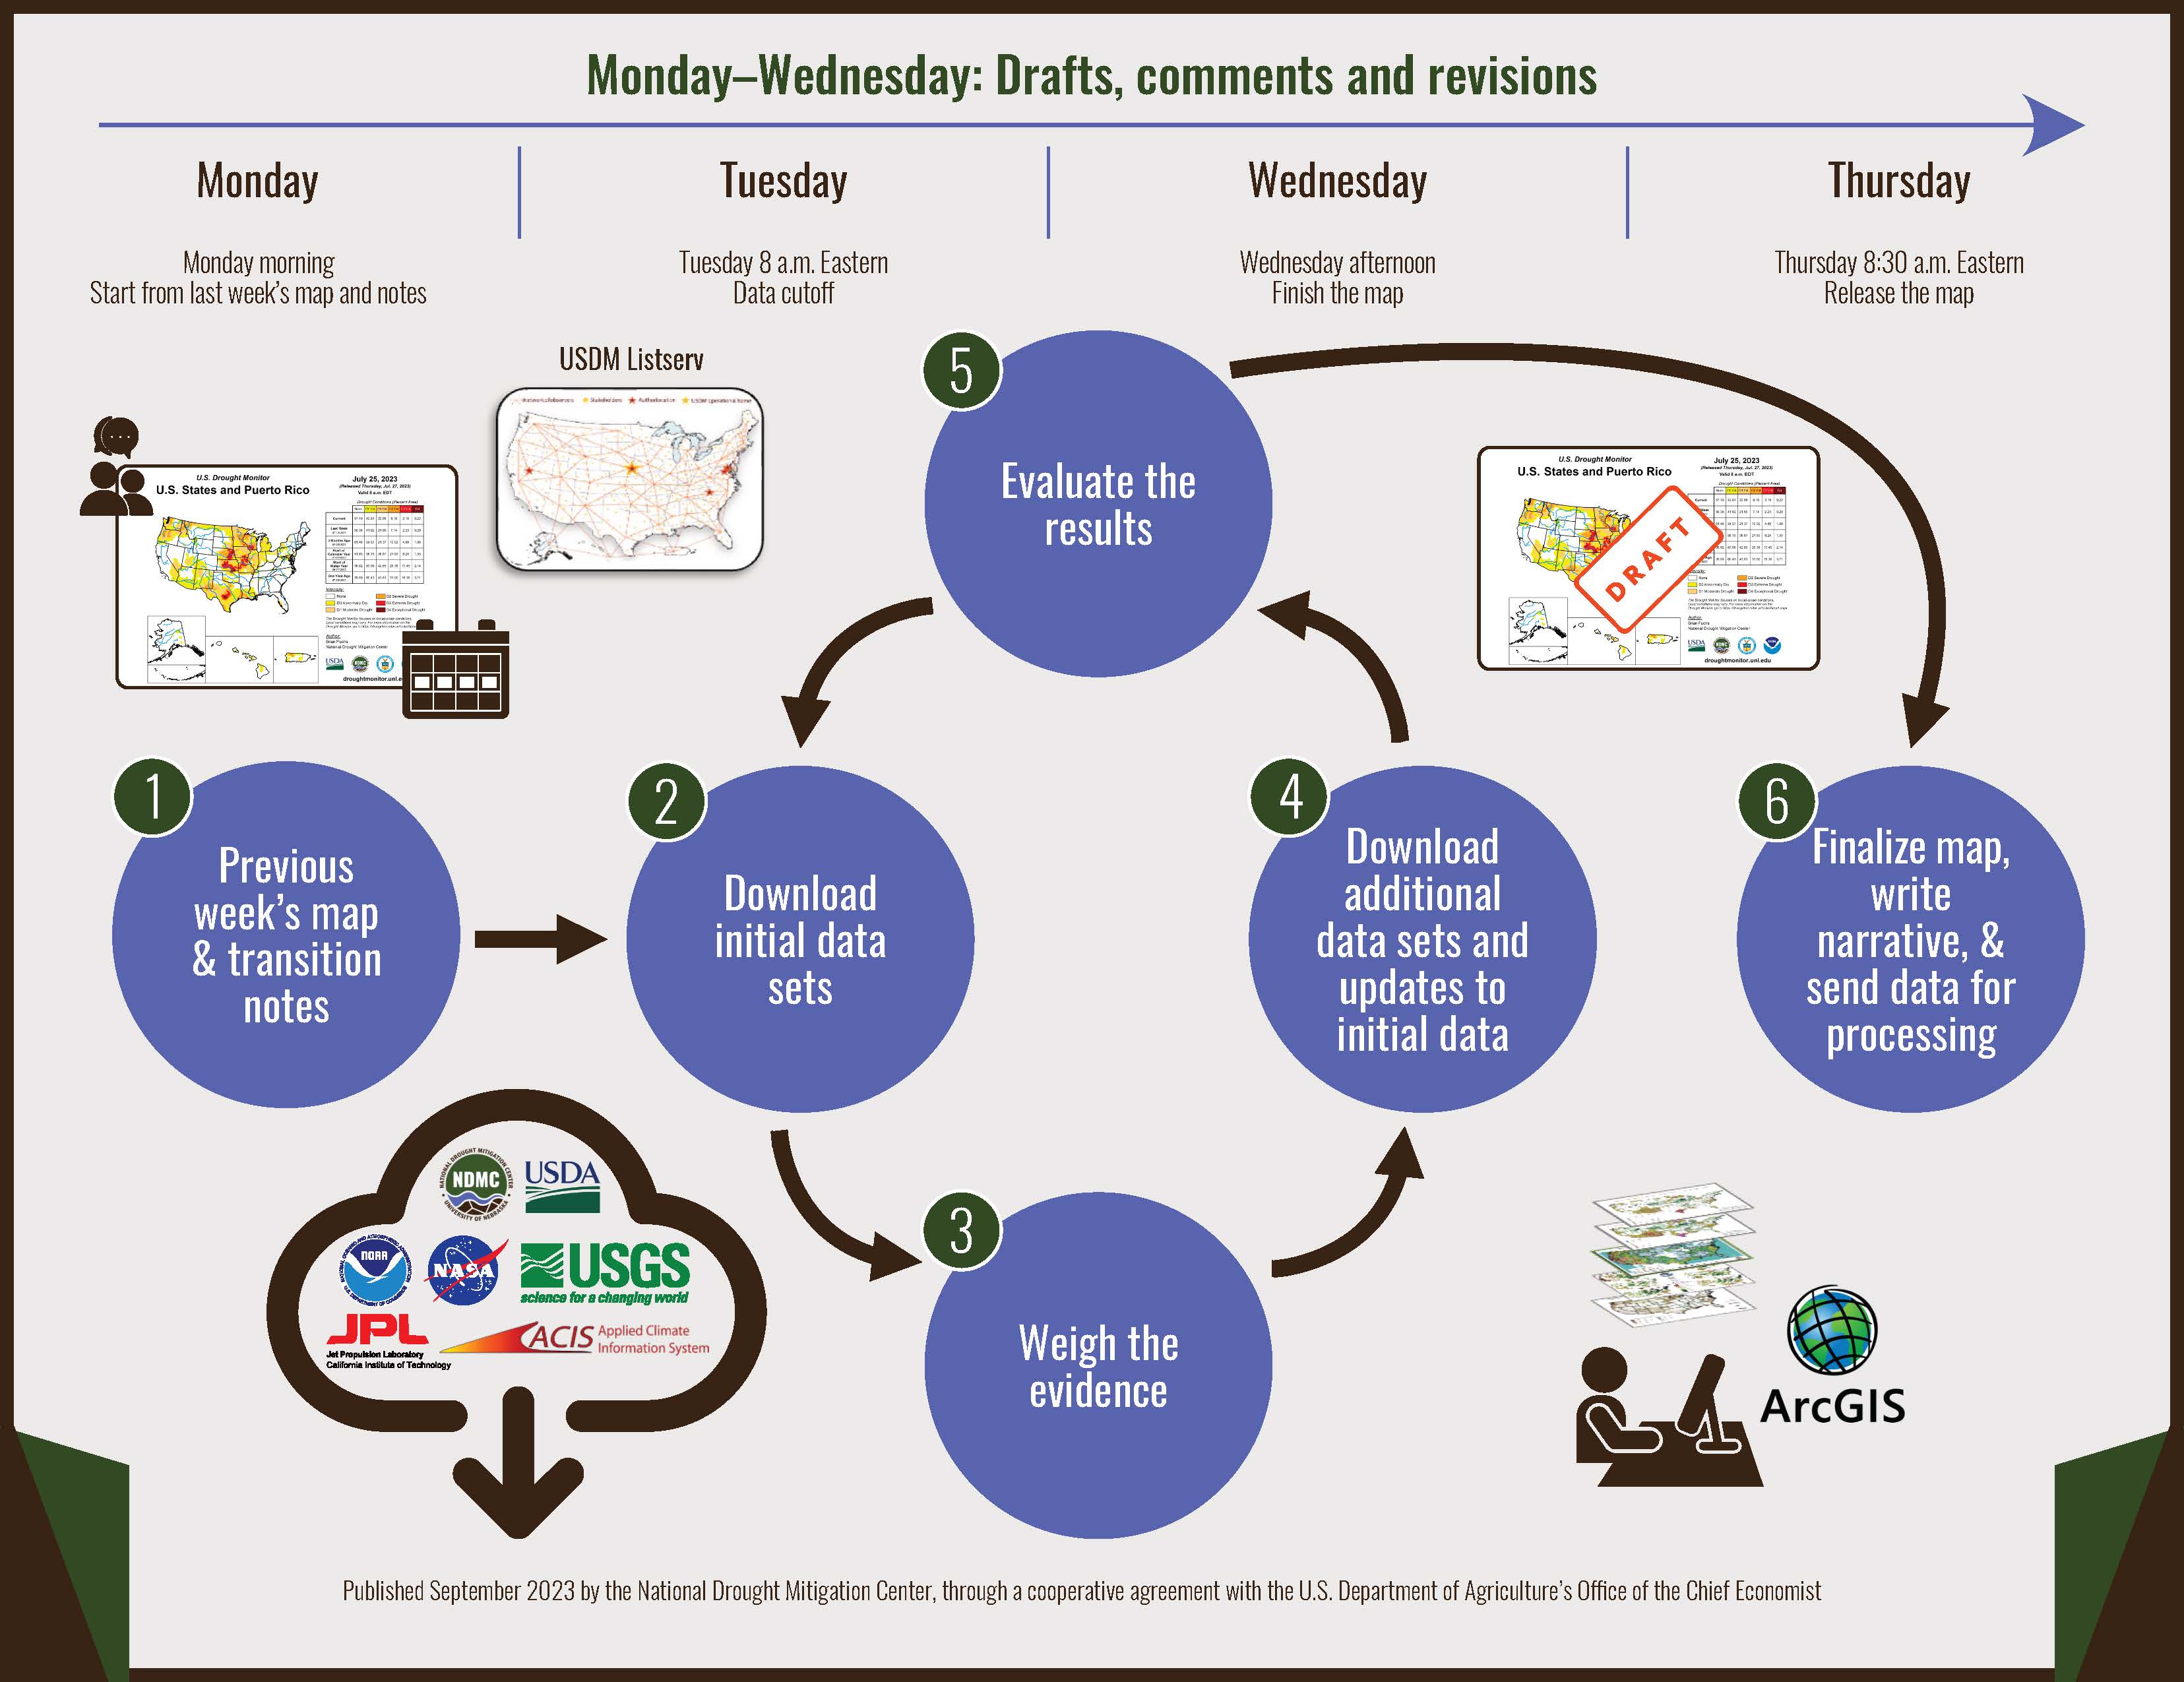
Process for making the weekly U. S. Drought Monitor map
- Begin with the previous week’s map. U. S. Drought Monitor authors download a Geographic Information System (GIS) shapefile containing the drought intensity lines and impact labels from the previous week. They also receive notes from the previous author informing them of any issues that arose during their shift, areas to watch, potential changes, and other information to support the transition between authors.
- Download data from multiple sites. No single website or provider has all the data to make the U. S. Drought Monitor map. Thus, authors download data from dozens of sites and data providers multiple times during their shift to collect all the information they need. Many providers now offer data as percentile rankings and in a GIS format, which is helpful because drought intensity levels directly correspond to percentiles. Note that the data cutoff (the time at which collected data is considered part of analysis) for the U. S. Drought Monitor is each Tuesday at 8 a.m. eastern time.
- Weigh the evidence using the convergence of evidence approach. To determine drought intensity, authors use GIS software to overlay maps of multiple types of data at multiple time scales (days, weeks, years). This process allows authors to see where data is converging—that is, what drought intensity level is indicated by most of the data. Some of these data include precipitation, streamflow, reservoir levels, temperature and evaporative demand, soil moisture, vegetation health, conditions observations, and reports of drought impacts. The author also considers data from site-specific models, combined indicators, and satellite indicators.
- Create a draft map. Drawing on their knowledge and experience and considering the location and season, the author creates a draft map. Normally, three to four drafts will be sent out between Monday morning and Wednesday afternoon for local expert input.
- Request expert feedback and evaluation. Authors send each draft map to over 450 local experts via the U. S. Drought Monitor listserv. By drawing on the collective and regional expertise of this group to help interpret the data and tie the indicators to local conditions and impacts, this step provides a built-in validation and peer review of the map. Depending on the day and time, authors repeat steps 2–5 over a three-day period.
- Finish the map. The author makes their final decisions on drought areas and intensity levels, modifies the impact lines and labels, writes the narrative, and sends everything to the National Drought Mitigation Center for processing and uploading to the U. S. Drought Monitor website. Processing includes producing different regional views, change maps, and statistics and takes about 15 hours to complete.
Requests to local experts providing input to the U.S. Drought Monitor
Please do:
- Send contributions to the full listserv: drought@lists.unl.edu
- Include the state(s) or geographic area you are discussing in the subject line. This helps the author and others identify posts related to their area of interest or potential border issues.
- Limit total attachments to 2 MB or less.
- Use the most recent USDM map or draft to show your recommended placement of lines.
- Summarize your changes and justification, preferably with bullet points.
- Include or identify the products, time scales, and sources of data used when making your recommendations.
- Use percentiles when referring to your supporting data. Percentiles are the backbone of the USDM methodology.
- Include impact information when possible.
- Recognize that authors do not consider relief programs or other map uses when determining drought classification.
- Acknowledge that the USDM protocol is to limit changes to a single category per week.
- Contribute during all seasons.
- Come to a state or regional consensus prior to sending recommendations.
- Recognize that disagreements happen. The USDM is a weekly product and adjustments can be made the following week.
Please don’t:
- Share the map or narrative with anyone outside of your state monitoring team or the national listserv until after its official release on Thursday morning.
- Use local or specific geographic features, regions, management areas, or highways in describing the location.
- Email large attachments, as these clog inboxes and frequently get rejected by email servers.
- Draw your recommendations on maps and products such as Advanced Hydrologic Prediction Service, forecast maps, etc.
- Include long text descriptions or email chains.
- Cherry-pick data, selecting one or two indicators from what is available. The USDM is not trying to mimic any one or handful of indices/indicators.
- Use percent of normal precipitation (PNP). PNP only uses the most recent 30-year reference period.
- Expect the drought classification to change based on impact information alone.
- Focus on a single type of drought. The USDM tries to show all types of droughts on one map.
- Forget that precipitation takes time to move through the hydrological cycle.
- Let potential changes fall through the cracks.
- Forget that authors have the final say on how the map will look.
- Ask for retroactive changes to be made to the map. Once the USDM is completed and published, it is final.
Acknowledgements: The virtual workshop was co-hosted by the Northwest Climate Hub, the National Drought Mitigation Center, and NOAA National Integrated Drought Information System. Work by the National Drought Mitigation Center was funded by the USDA Office of the Chief Economist.


