

A priority goal of nutrient management planning is to prevent recently applied fertilizers and manures from washing off farm fields during rainfall events.
When rainfall occurs shortly after nutrient application, nutrients like nitrogen and phosphorus can be quickly transferred to runoff waters. This process is informally known as nutrient wash-off. Nutrient wash-off events have the potential to produce large (but short-lived) losses of nutrients (Preedy et al., 2001) to surface waters. Thus, nutrient wash-off events are of great concern for water quality. Nutrient wash-off events also remove nutrients that would otherwise support soil fertility and crop production. This results in costs to the farmer.
In light of these concerns, the farming community has expressed interest in using runoff forecasts to improve their decisions around when to apply fertilizer and manure (Easton et al., 2017). Optimizing the timing of nutrient applications represents one of the four pillars of nutrient management planning, better known as the 4Rs (Figure 1). If runoff events could be reliably forecasted several days ahead, then farmers could schedule their nutrient applications for crop production needs and avoid losing nutrients to runoff. While a growing number of runoff forecasting systems are under various stages of development and use, verifying their accuracy and reliability remains an important research need.
Research brief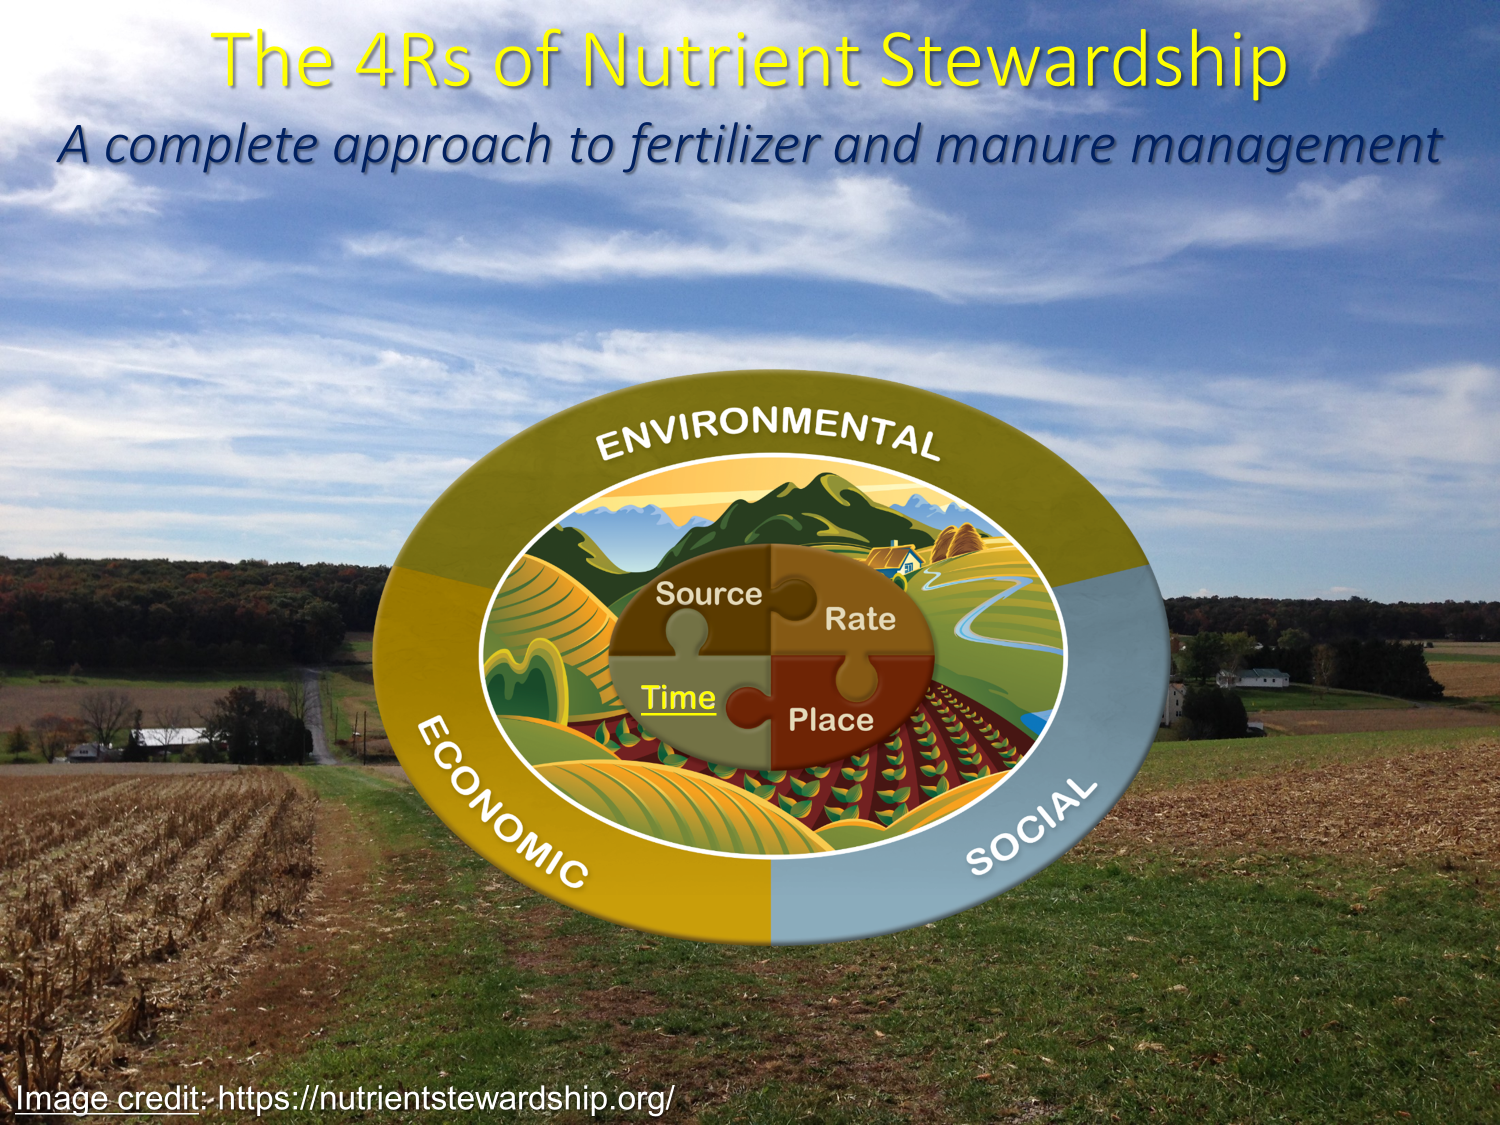
Figure 1: The 4Rs of nutrient stewardship provide a framework for guiding fertilizer and manure applications. The 4Rs include the right source, right rate, right time, and right place. Runoff forecasting is intended to address the timing component of 4R nutrient management.
Approach
To address this need, researchers from USDA’s Agricultural Research Service (ARS), NOAA’s National Weather Service (NWS), and Penn State University teamed up to examine the prospects for short-range (lead times out to three days) runoff forecasting in sloping agricultural terrain typical of central Pennsylvania (Buda et al., 2022). The study took place in Mahantango Creek, a 420-km2 (160-mi2) agricultural watershed that drains to the Susquehanna River about 40 km (25 mi) north of Harrisburg, PA. With continuous monitoring of streamflow and weather dating to 1968, the Mahantango Creek experimental watershed represented an ideal place to examine daily runoff forecasts.
Prior to conducting forecasting experiments, the research team needed to first show that a hydrologic model could reliably predict runoff in Mahantango Creek. They selected the Sacramento Soil Moisture Accounting Model (SAC-SMA) for this task because the NWS has had broad experience using the model to predict streamflows across the US. In Mahantango Creek, the SAC-SMA model was used to keep regular track of daily water inputs (precipitation, snowmelt) and outputs (runoff and baseflow components of streamflow, evapotranspiration) for a period of 15 years (2004 – 2017). Over this same 15-year period, a simple algorithm was used to estimate daily runoff amounts from continuous streamflow data in Mahantango Creek (Figure 2). The research team found strong agreement between historical runoff observations and predictions of runoff by the SAC-SMA model. These promising results supported the use of the SAC-SMA model for short-range runoff forecasting experiments.
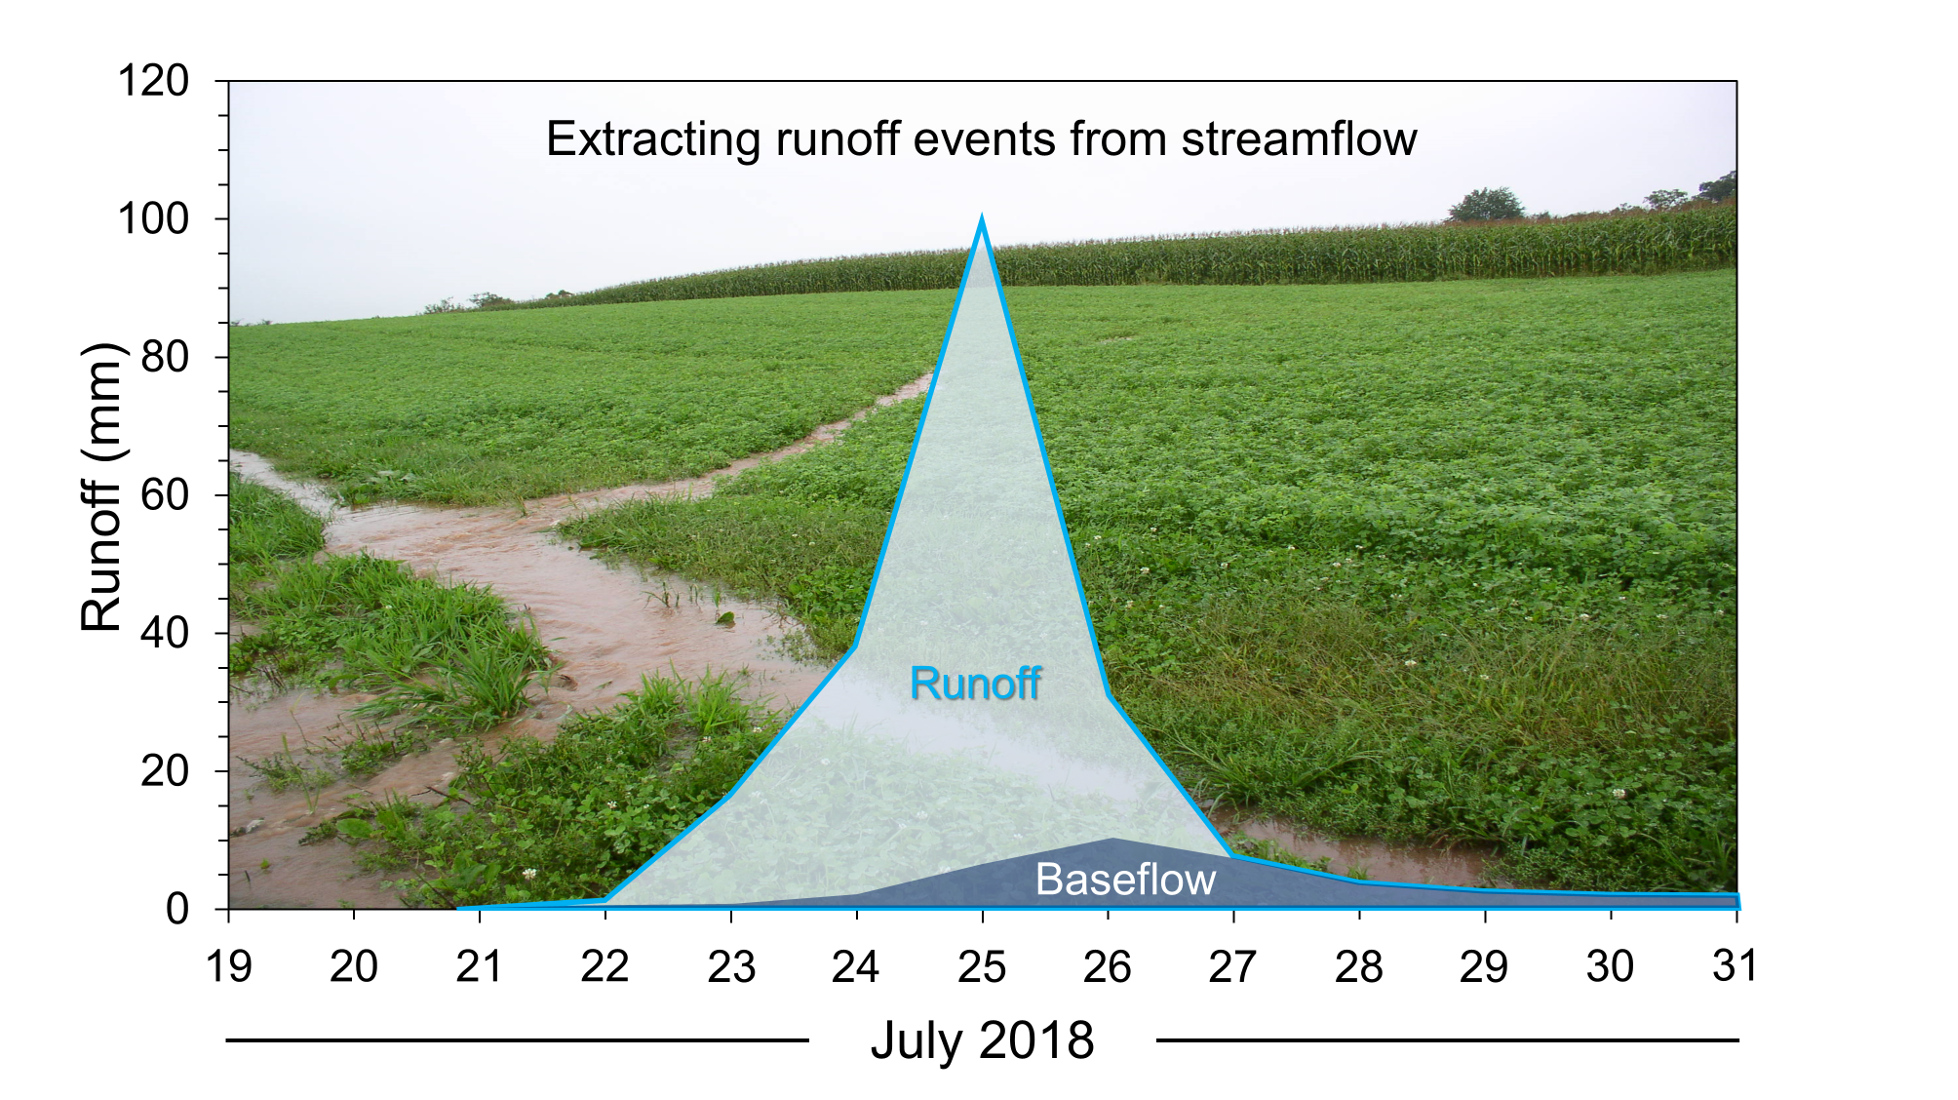
Figure 2: Diagram showing how streamflow was separated into slow components like baseflow and fast components like runoff. The example runoff event, which occurred in late July 2018, was triggered by repeated bouts of heavy thunderstorms over a several day period. For this event and others in the dataset, a simple digital filtering algorithm was used to automatically estimate daily runoff amounts from continuous streamflow observations.
Runoff Forecasting Experiments
The team used the calibrated SAC-SMA model to conduct a series of runoff forecasting experiments using just over two years of data (July 2017 – October 2019). Highlighted here is the last experiment that tested whether the SAC-SMA model could correctly place its runoff forecasts into one of four categories of increasing event size. Indeed, many early warning systems for natural hazards use naturally ordered categories (low to high). As a result, the research team felt that such a classification system could form the basis for a runoff forecasting platform applied to agricultural decision making.
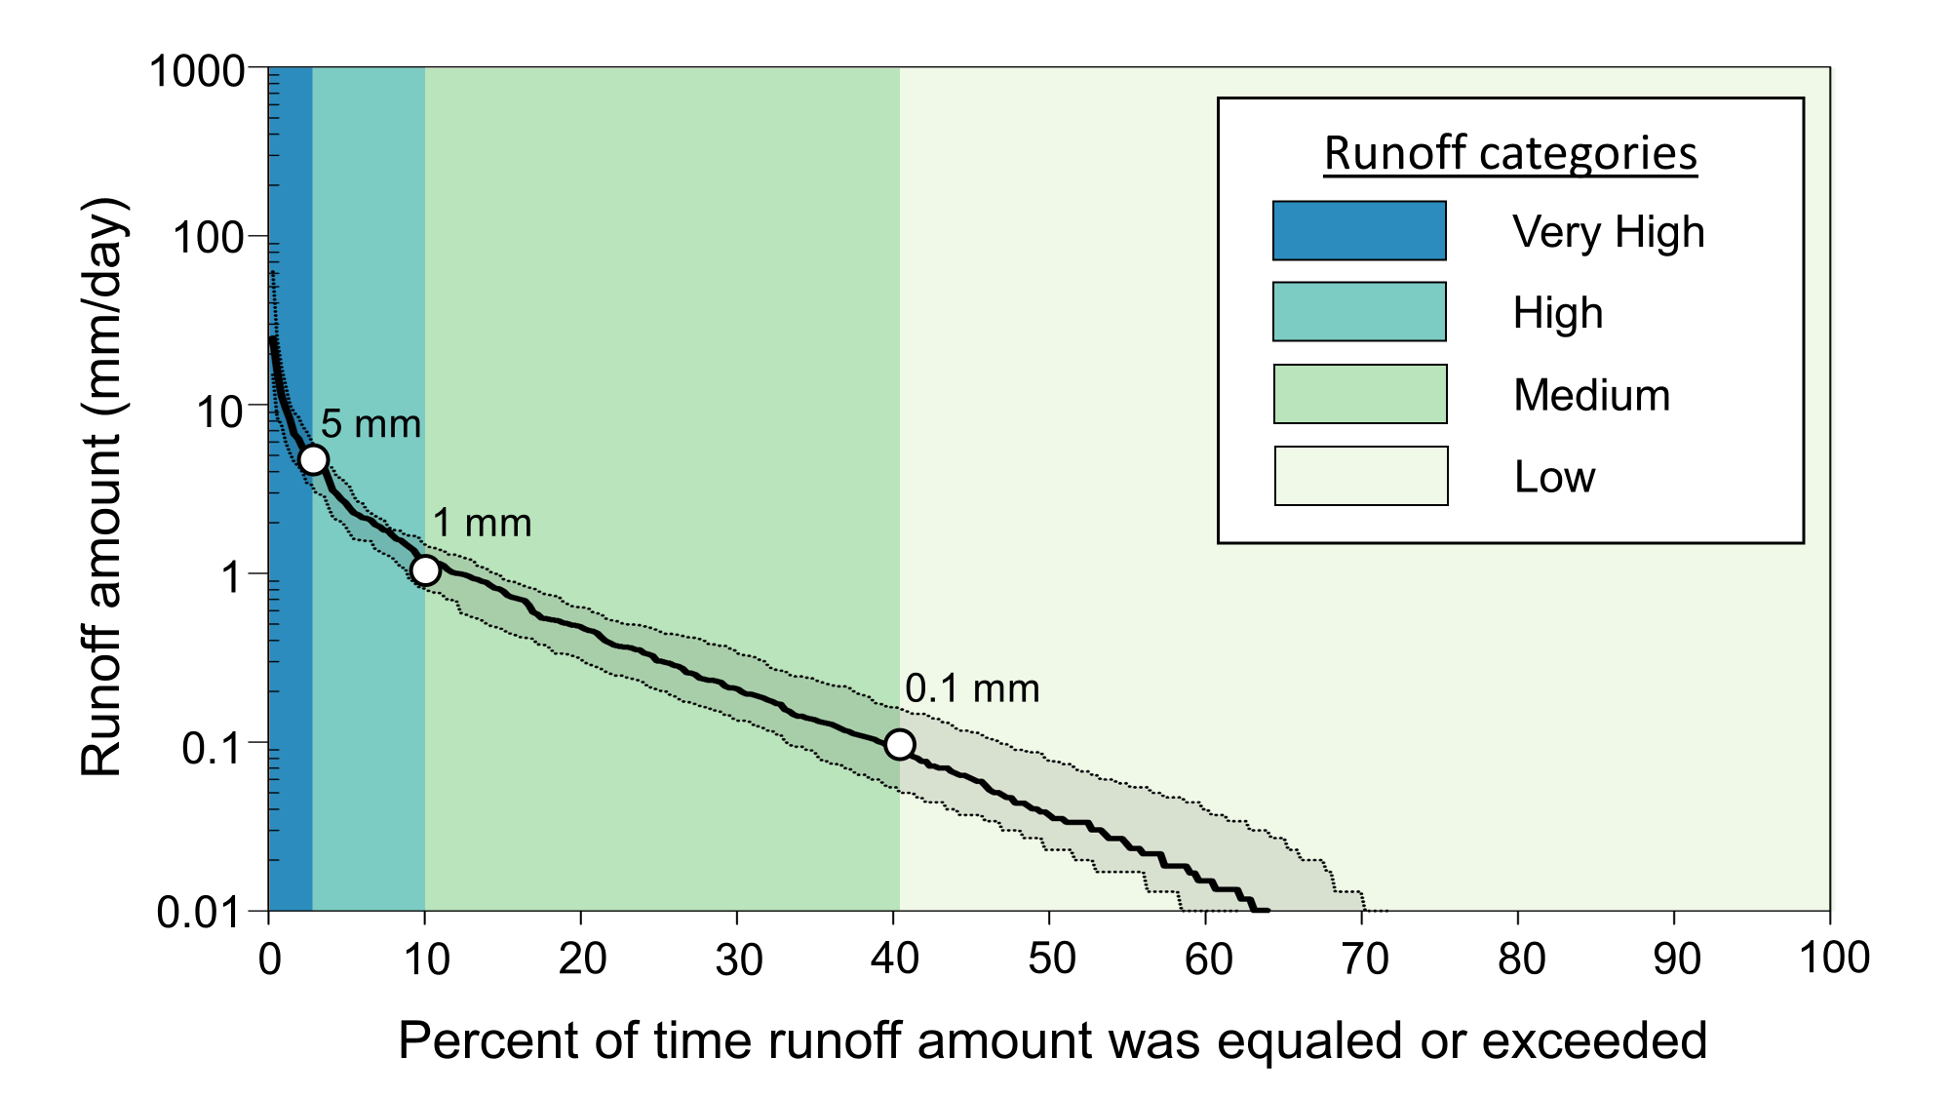
Using a graph of the magnitude and frequency of observed runoff in Mahantango Creek (Figure 3), four categories of event size were created: low (< 0.1 mm/day), medium (0.1 – 1 mm/day), high (1 – 5 mm/day), and very high (> 5 mm/day). According to the graph, low runoff amounts happen frequently, while very high runoff amounts occur much less often. Given the rarity and impact of the largest runoff events, it is essential that these events be correctly forecasted.
A common approach to evaluating forecasting systems is to compare their forecasts to naïve or simple reference forecasts. Such comparisons offer insight into forecast skill. In basic terms, skill measures the improvement in accuracy of a forecasting system relative to the reference forecast. In this experiment, persistence was used as the reference forecast. A persistence forecast assumes that future runoff conditions will be the same as the current conditions. Thus, if 1 mm of runoff is observed today, a persistence forecast would predict 1 mm of runoff for lead times of one, two, and three days ahead.
The team selected the Gerrity Score as the most appropriate measure of forecast accuracy. Simply put, the Gerrity Score estimated the accuracy of SAC-SMA and persistence forecasts in predicting the correct category of runoff size for different lead times. More importantly, the Gerrity Score gave greater weight to correct forecasts of rare events (very high runoff) than correct forecasts of more common events (medium to low runoff). The Gerrity Score ranges from -1 to 1, with a perfect score of 1. Comparing Gerrity Scores of SAC-SMA forecasts versus persistence forecasts offered insight into forecast skill.
Findings and implications
As shown in Figure 4, runoff forecasts issued by SAC-SMA had greater accuracy than persistence runoff forecasts at all lead times. Thus, the SAC-SMA forecasting system produced skillful forecasts of runoff. Even so, absolute forecast accuracy declined for SAC-SMA and persistence forecasts as lead time increased. Notably, day-ahead forecasts issued by SAC-SMA correctly classified the extreme runoff event in July 2018 (Figure 2) as a very high runoff event (< 5 mm), while persistence forecasts misclassified the event as a much smaller event. Overall, the SAC-SMA model correctly forecasted a greater proportion of very high runoff events relative to the persistence forecast, which contributed to its forecast skill.
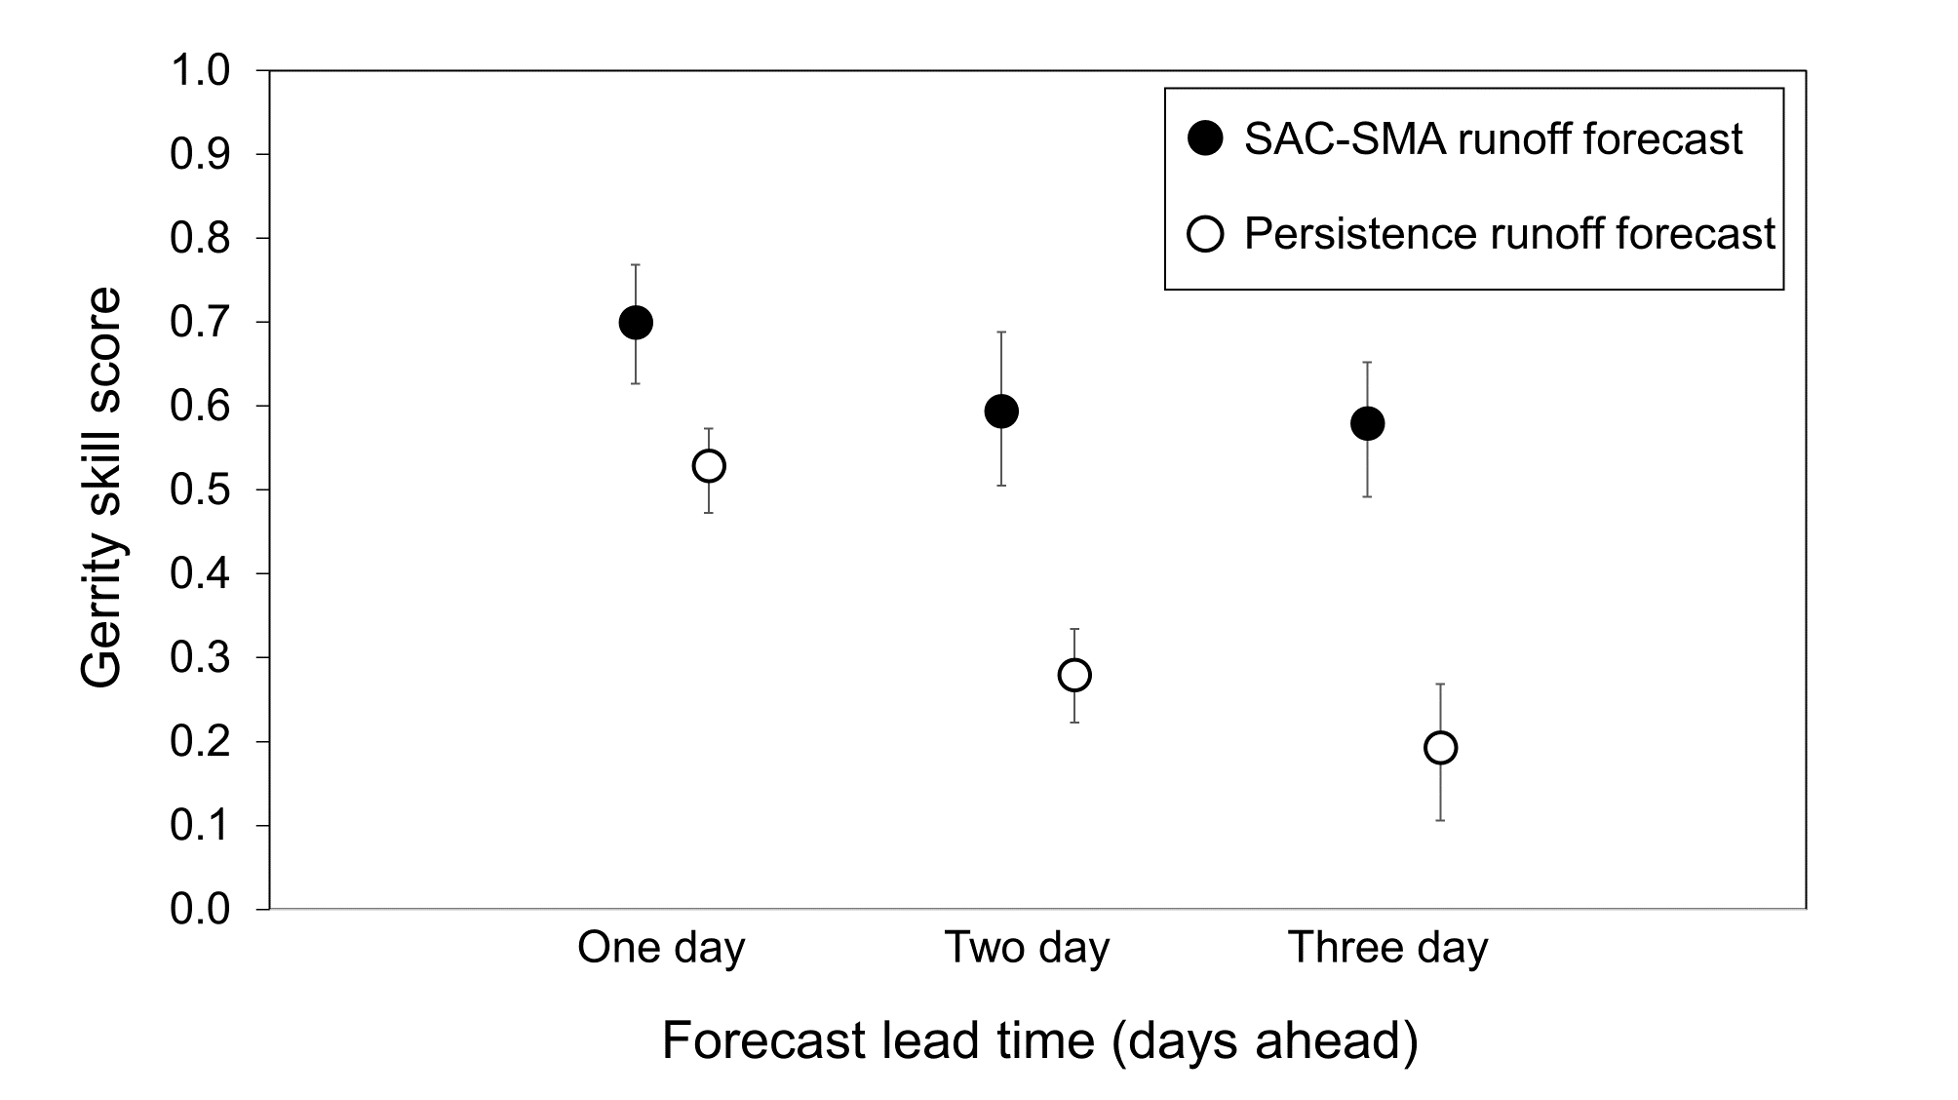
Figure 4: Gerrity skill scores for one-day, two-day, and three-day runoff forecasts issued by SAC-SMA and persistence in Mahantango Creek. For each lead time, the point indicates the value of the Gerrity Skill Score, while the 95% confidence intervals indicate the uncertainty surrounding each value.
Findings from this study show that hydrologic models, like SAC-SMA, can provide useful short-range forecasts of runoff that could support daily decision making in agriculture. In particular, the skill of SAC-SMA in forecasting large runoff events is noteworthy. Looking ahead, there is a need to examine runoff forecasts at longer lead times (five to seven days). In addition, weather forecasts are often based on groups of models, called ensembles. In future studies, researchers will need to consider whether ensembles of hydrologic models can offer better insight into the certainty of a given runoff forecast.


