Estimated reading time: 6 minutes
Key points:
- Snow is a key source of water for ecosystems and people in the Northwest.
- Snow water equivalent (SWE) determines how much water the snowpack contains, helping water and resource managers plan for water use.
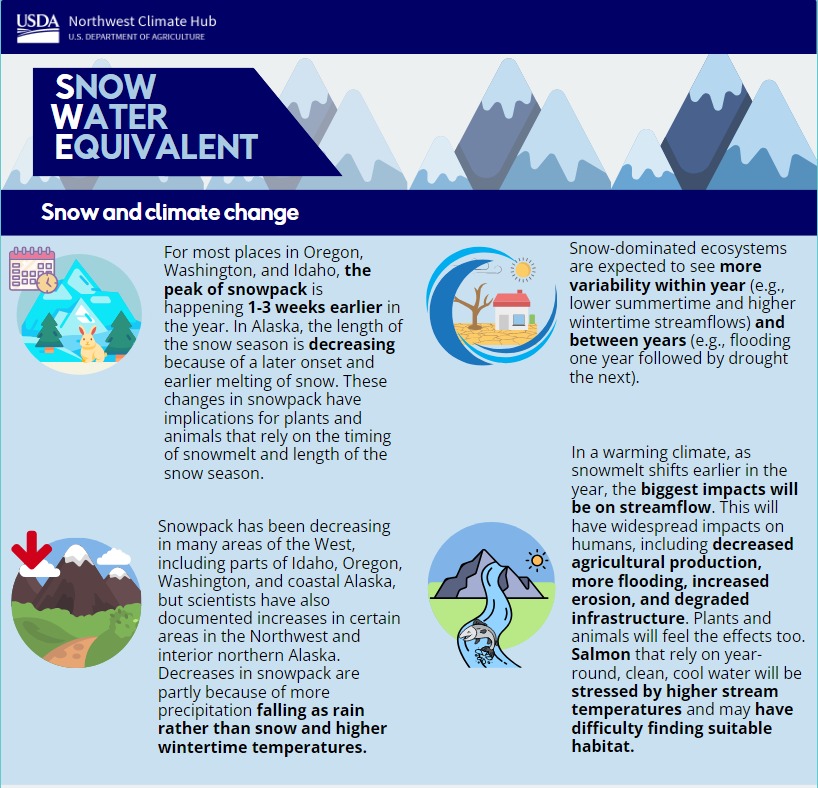
- Increased temperature due to climate change will likely decrease snowpack in the Northwest, which will have broad impacts on water resources.
Snowpack is one of the most important resources in the Northwest, both economically and ecologically. In the West, mountains act as natural reservoirs by collecting snow in the winter and releasing it in the spring as temperatures increase. Between 60 and 70% of water supplies come from snowmelt, with high mountain regions being on the high end of that range. Snow is a critical water resource in portions of Alaska, Idaho, Oregon, and Washington, supplying water to farms, forests, and communities. Knowing how much water will come from snow on an annual basis is important for both short- and long-term planning.
Snow water equivalent - SWE
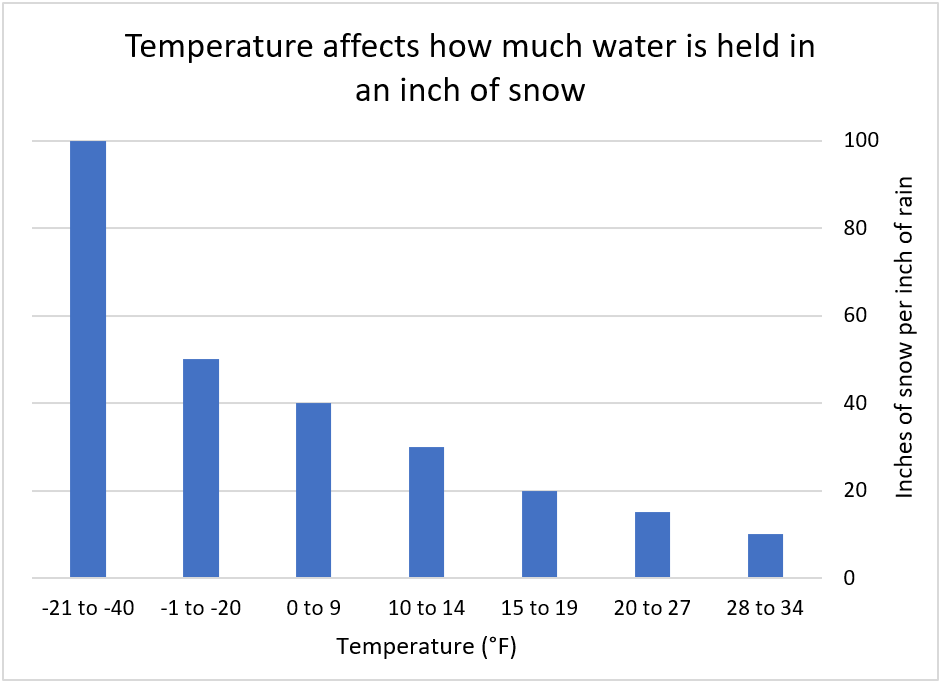
Snow water equivalent (SWE) determines the amount of water available in the snow. Measuring how much water is in snow can be difficult since the temperature of the air controls how much water is held in an inch of snow. One inch of rain can produce from two inches of sleet to 50 or more inches of snow depending on how cold the air is. Different storms bring different types of snow that can hold different amounts of water. Warmer-weather snowstorms can create two inches for sleet for an inch of rain, whereas very cold snowstorms may create over 50 inches of very dry, powdery snow for an inch of rain. Throughout winter, different storms bring different types of snow, so snow depth does not translate directly to the amount of water held in snow. Because of this variability, SWE helps to understand how much water the snow contains.
Ways to keep track of SWE
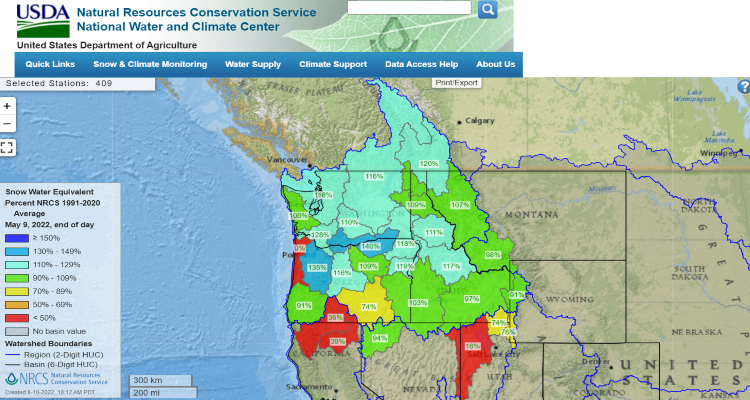
Snow water equivalent (SWE) has been measured manually in the U.S. since the early 1900s by the USDA Natural Resources Conservation Service (NRCS), providing a long history of snow conditions in the West. Over 400 manual snow courses are still measured annually in the Northwest and Alaska. Starting in the late 1970s, nearly 300 Snow Telemetry (SNOTEL) sites were installed in Idaho, Oregon, Washington, and Alaska to automatically measure SWE (using devices called snow pillows). These sites make gathering data easier and more efficient than in the past, tracking daily values of snow to see in detail how snowfall is changing. Snow pack monitoring is conducted by the USDA NRCS Snow Survey and Water Supply Forecasting Program and you can find the latest information and reports from each state office: Alaska, Idaho, Oregon, and Washington.
-
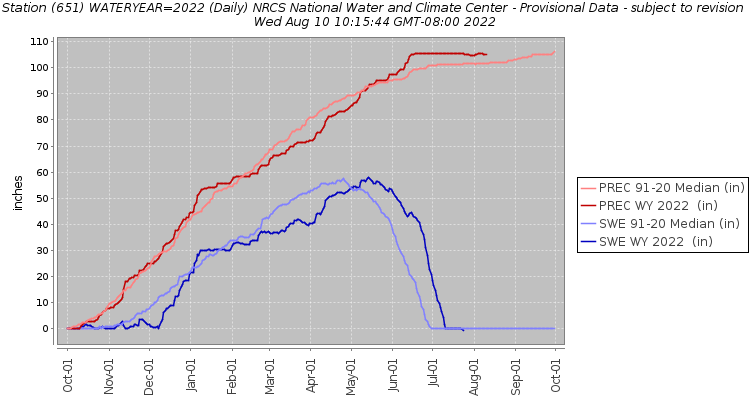
Allow users to track snow and total precipitation and compare them to historic medians across the water year.
-
Show important metrics such as the timing, volume of the peak of snowpack as well as timing and rate of snowmelt.
Changes in snow in the Northwest
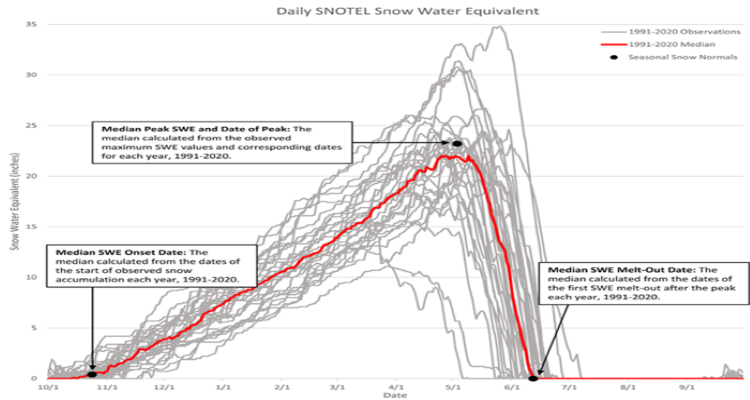
Snowpack has been decreasing in many areas throughout the West including parts of Idaho, Oregon, Washington, and coastal Alaska, but scientists have also seen increases in certain areas in the Northwest and interior northern Alaska. In general, the regional average level of snowpack is decreasing. Because many SNOTEL sites have been automatically taking measurements since the 1970s, they have allowed scientists to see changes to snowpack that may have been missed otherwise. One of these changes is a shift of the peak snowpack. Historically, April 1 has been used as a consistent date to reference among peaks as it is considered the peak or near-peak of snowpack. This is partially because when snow data was gathered manually, observations were taken monthly on or near the beginning of the month, but automatic measurements confirmed this being the peak for most sites.
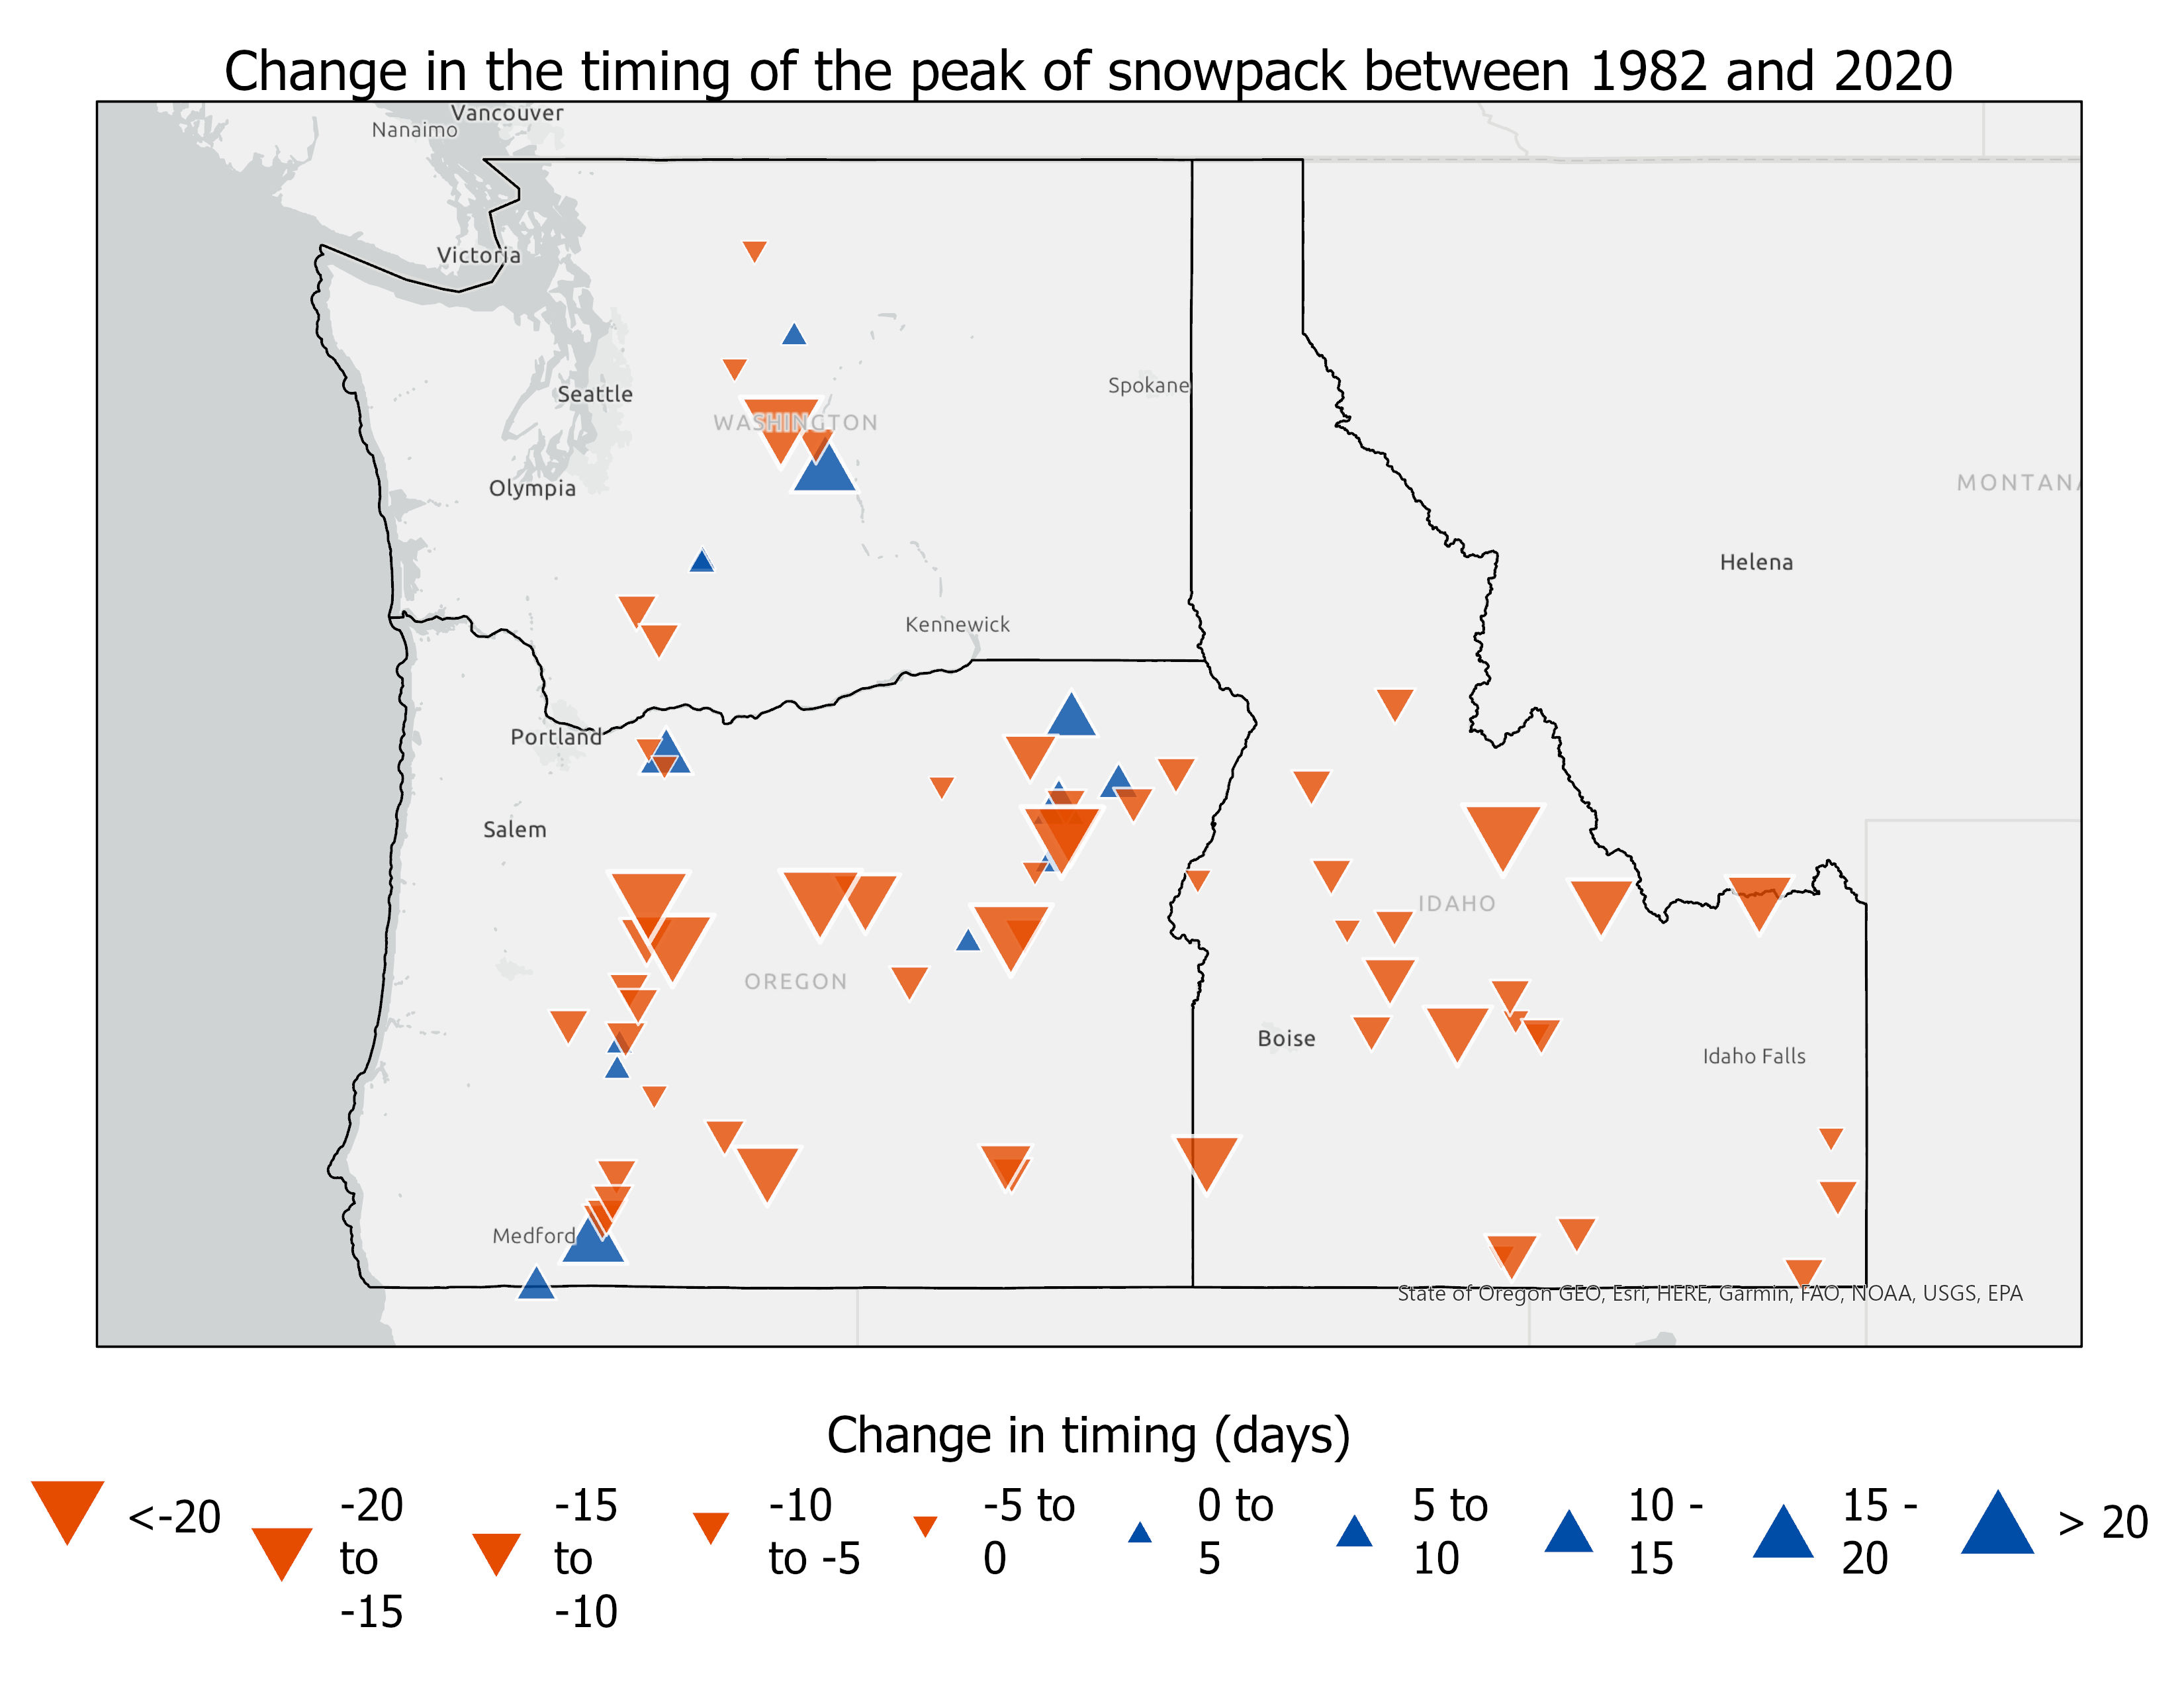
As the climate has changed, the amount of snowpack on April 1 and the snow peak have been changing shifting. Throughout Idaho, Oregon, and Washington, some SNOTEL sites during certain years show the peak moving 1–3 weeks earlier in the year since 1982, as seen in the map below. Other sites show this peak moving later in the year. Because the amount of water in snow on April 1 is used for water allocation, it is important to pay attention to changes in the timing of this peak; increasing variability among sites can make water allocation more challenging. Altered peak of snowpack also has implications for plants and animals that rely on the timing of snowmelt. This includes trees that rely on snowpack for insulation from freezing temperatures and fish that rely on streamflow levels for spawning.
In addition to the timing of the peak of snowpack becoming more variable year to year, the amount of snow at the peak is decreasing at many sites. The graph below represents an example of one SNOTEL site, but this pattern is seen throughout many SNOTEL sites in the West. The graph shows that changes in the peak also change how we interpret what is normal for a SNOTEL site. Because new normals are calculated every decade, we compare snow levels to data from the previous 30 years. For example, between the years of 2021 and 2030, we consider “normal” for each SNOTEL site to be the median of snowpack from the previous 30-year period, 1991-2020. This means that as regional snowpack has decreased with climate change, so has what is considered “normal.”
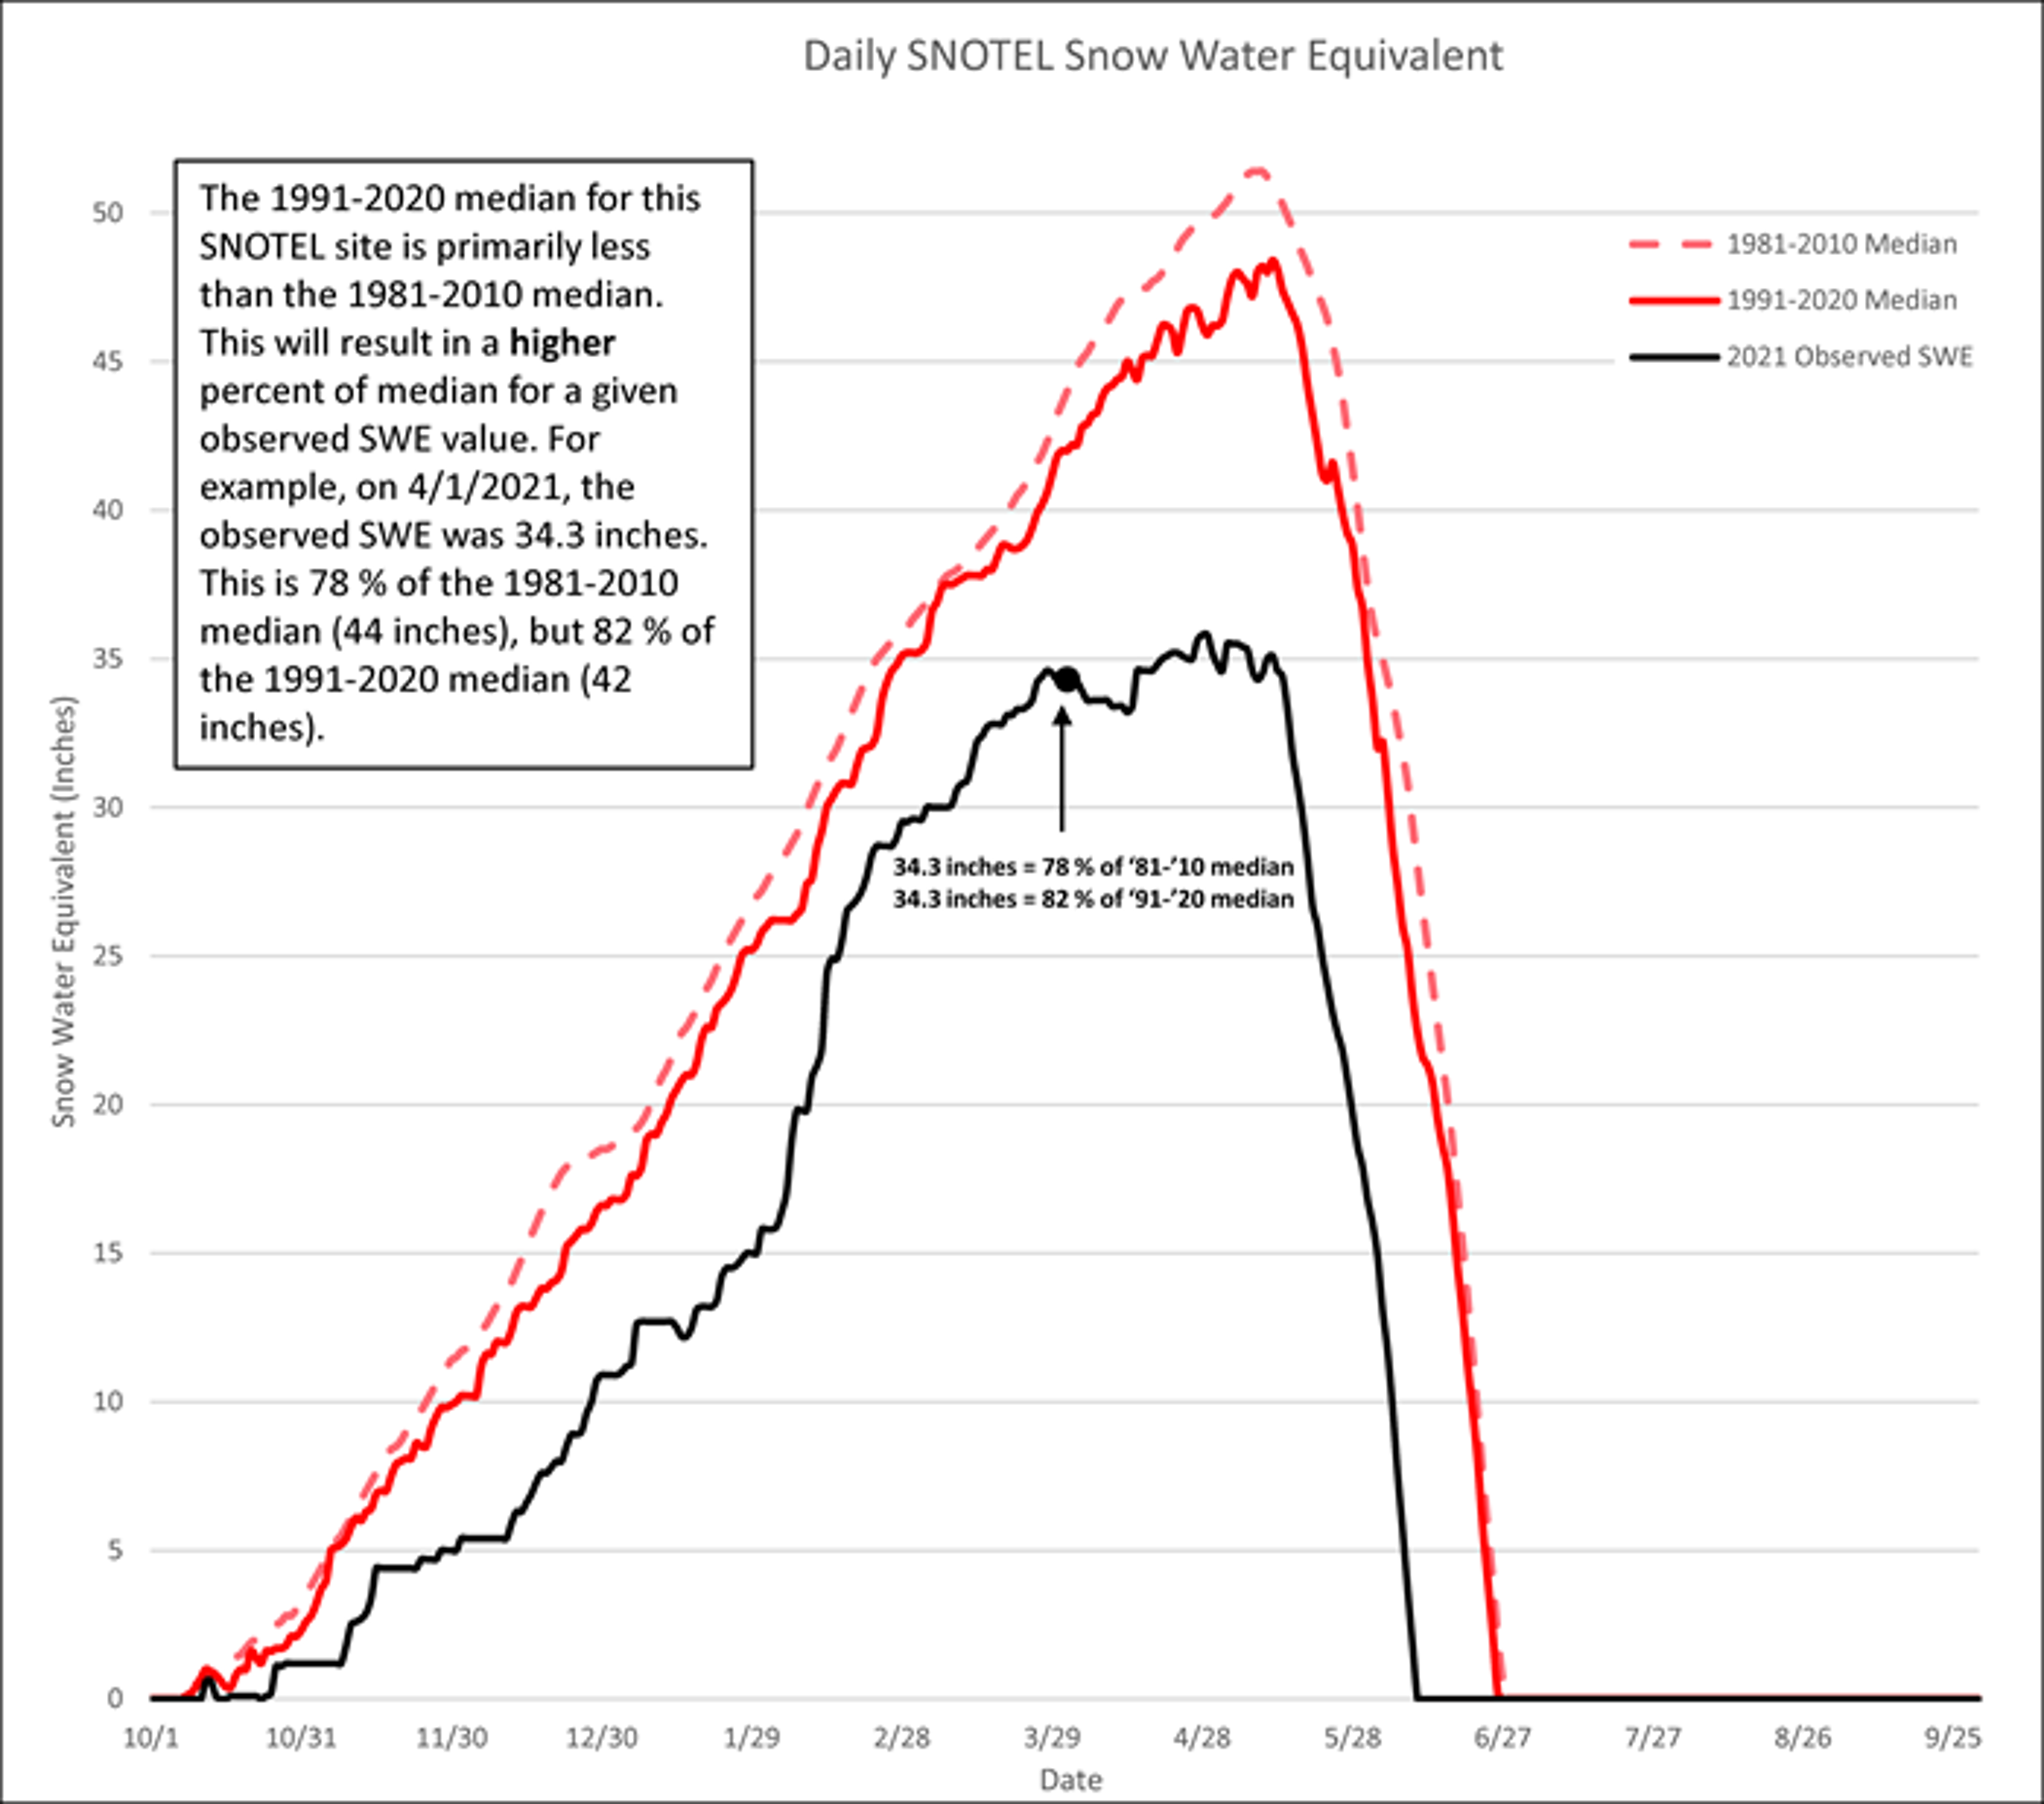
In the graph above, we can see that when we compare the black line to the two red lines, it’s a lower percentage of the 1981-2010 normal (dotted red line) than it is for the 1991-2020 normal (solid red line). For the sites where normal levels of snowpack have been decreasing throughout the region, something that is 100% of normal now may be much lower than the historic “normal” for that SNOTEL site. These changes are concerning because less snowpack means less water as we move into the future. These decreases could have large impacts on the Northwest.
What effects will these changes have?
As regional snowmelt shifts earlier in the year, one of the largest effects will be to the timing of water availability. Water will enter streams and rivers earlier, meaning that less will be available in the summer months. It is important to note that future changes to precipitation could increase the average of streamflow through the year, but the summer streamflow is expected to decrease. Some changes in streamflow will be the result of changes in groundwater recharge. Although projecting how climate change will alter interactions between surface water and groundwater is difficult, most models agree that mountain system aquifers are likely to see reduced inputs due to decreased snowpack. When we look at actual streamflow, models show that in the Northwest, snow-dominated ecosystems will have higher variability under climate change, both year to year (e.g., flooding one year and low flow the next) and within year (e.g., higher winter flow and lower summer flow). Most of these streams and rivers will follow the pattern of reduced summertime flows, but the magnitude of change is influenced by several other factors (e.g., bedrock geology).
Changes in summertime flow from decreased snowmelt will be felt throughout the region. The Columbia River basin depends on irrigation to sustain agriculture, and changes to snowmelt will affect how much water is available for irrigation. This may reduce food availability both regionally and globally, as the Northwest is a top producer of several crops in the US including apples, potatoes, barley, and hazelnuts. Ranchers will also be affected as changes in snowmelt will affect forage quality, quantity, and availability.
In the future, more precipitation will fall as rain. Because snow holds water and releases it slowly, this will affect the timing and magnitude of streamflow peaks. This could lead to increased erosion and degrade certain types of infrastructure such as dams, culverts, roads, and bridges. In addition, the timing of water release from reservoirs could be affected by earlier snowmelt. An earlier snow melt and more rain rather than snow may stress these systems and lead to more flooding or require dams to release water earlier in the year.
Animals, plants, and people who depend on them will also be affected by decreased regional snowmelt. Fish such as salmon are dependent on clean, cool water flowing year round and lower summer flows will mean warmer water temperatures. This will create challenges for fish, either forcing them to live in warmer water or swim much farther to find water that is cold enough for them to survive in, especially as air temperatures increase. Different species have different life cycles, and the young of certain species such as coho salmon spend an entire year in rivers before migrating to the ocean, so this heat stress could affect this vulnerable population as well as affect the way of life for many Tribes. Many animals rely on year-round stream flow for their water supply, and they may need to travel farther or migrate to different parts of the region as summer flows decrease. Snowmelt timing will also affect the plants that animals use for food and cover, especially plants along streams and rivers. Altered timing could affect the ability of plants to successfully establish and may create a more favorable environment for certain invasive species.
Fact Sheet
-
Snow Water Equivalent in the Northwest